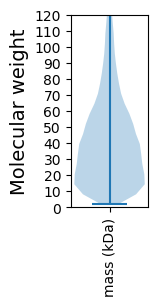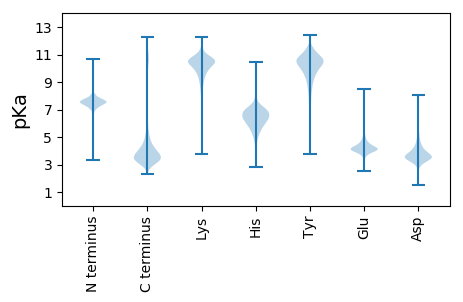
Coffea canephora (Robusta coffee)
Taxonomy: cellular organisms; Eukaryota; Viridiplantae; Streptophyta; Streptophytina; Embryophyta; Tracheophyta; Euphyllophyta; Spermatophyta; Magnoliopsida; Mesangiospermae; eudicotyledons; Gunneridae; Pentapetalae; asterids; lamiids; Gentianales; Rubiaceae; Ixoroideae;
Average proteome isoelectric point is 6.76
Get precalculated fractions of proteins

Virtual 2D-PAGE plot for 25401 proteins (isoelectric point calculated using IPC2_protein)
Get csv file with sequences according to given criteria:
* You can choose from 21 different methods for calculating isoelectric point
Summary statistics related to proteome-wise predictions


Protein with the lowest isoelectric point:
>tr|A0A068VAB2|A0A068VAB2_COFCA Uncharacterized protein OS=Coffea canephora OX=49390 GN=GSCOC_T00001682001 PE=4 SV=1
MM1 pKa = 7.18AAVYY5 pKa = 10.63SFVDD9 pKa = 3.45TATDD13 pKa = 3.56PFNNSDD19 pKa = 4.05LMEE22 pKa = 4.38SQQQYY27 pKa = 7.42MQAIALPANFVSPWDD42 pKa = 4.76DD43 pKa = 3.17EE44 pKa = 4.37DD45 pKa = 4.52HH46 pKa = 7.22PEE48 pKa = 3.93NFIPGPEE55 pKa = 4.02DD56 pKa = 3.05QYY58 pKa = 11.46RR59 pKa = 11.84PQSIQEE65 pKa = 3.95SWEE68 pKa = 3.82EE69 pKa = 5.41DD70 pKa = 2.93EE71 pKa = 5.57DD72 pKa = 4.07QPEE75 pKa = 4.74NIPPPNSIQYY85 pKa = 9.24GGHH88 pKa = 5.7WDD90 pKa = 3.25IPQVYY95 pKa = 10.08DD96 pKa = 4.04EE97 pKa = 5.13YY98 pKa = 11.54DD99 pKa = 3.76DD100 pKa = 6.0DD101 pKa = 5.05GEE103 pKa = 4.47PDD105 pKa = 3.53EE106 pKa = 5.01EE107 pKa = 4.42FVDD110 pKa = 3.74ILGEE114 pKa = 3.9LAEE117 pKa = 4.54LNGEE121 pKa = 3.78IVTFGNEE128 pKa = 3.59LGVILGFDD136 pKa = 3.36VLLDD140 pKa = 3.52QRR142 pKa = 11.84SNLSQEE148 pKa = 4.4IIAEE152 pKa = 4.0HH153 pKa = 6.22LQTLKK158 pKa = 10.54YY159 pKa = 10.21QKK161 pKa = 9.99LAKK164 pKa = 9.67QDD166 pKa = 3.51EE167 pKa = 4.82DD168 pKa = 3.78EE169 pKa = 5.42DD170 pKa = 4.43EE171 pKa = 4.33VDD173 pKa = 4.17EE174 pKa = 5.45LCVICQDD181 pKa = 3.6EE182 pKa = 4.75FKK184 pKa = 10.66SGEE187 pKa = 3.88MLGTLGCRR195 pKa = 11.84HH196 pKa = 6.21EE197 pKa = 4.38FHH199 pKa = 7.39ADD201 pKa = 3.75CITRR205 pKa = 11.84WLQVKK210 pKa = 8.16NVCPICKK217 pKa = 9.79RR218 pKa = 11.84MAVHH222 pKa = 5.98HH223 pKa = 5.61QEE225 pKa = 3.69II226 pKa = 4.17
MM1 pKa = 7.18AAVYY5 pKa = 10.63SFVDD9 pKa = 3.45TATDD13 pKa = 3.56PFNNSDD19 pKa = 4.05LMEE22 pKa = 4.38SQQQYY27 pKa = 7.42MQAIALPANFVSPWDD42 pKa = 4.76DD43 pKa = 3.17EE44 pKa = 4.37DD45 pKa = 4.52HH46 pKa = 7.22PEE48 pKa = 3.93NFIPGPEE55 pKa = 4.02DD56 pKa = 3.05QYY58 pKa = 11.46RR59 pKa = 11.84PQSIQEE65 pKa = 3.95SWEE68 pKa = 3.82EE69 pKa = 5.41DD70 pKa = 2.93EE71 pKa = 5.57DD72 pKa = 4.07QPEE75 pKa = 4.74NIPPPNSIQYY85 pKa = 9.24GGHH88 pKa = 5.7WDD90 pKa = 3.25IPQVYY95 pKa = 10.08DD96 pKa = 4.04EE97 pKa = 5.13YY98 pKa = 11.54DD99 pKa = 3.76DD100 pKa = 6.0DD101 pKa = 5.05GEE103 pKa = 4.47PDD105 pKa = 3.53EE106 pKa = 5.01EE107 pKa = 4.42FVDD110 pKa = 3.74ILGEE114 pKa = 3.9LAEE117 pKa = 4.54LNGEE121 pKa = 3.78IVTFGNEE128 pKa = 3.59LGVILGFDD136 pKa = 3.36VLLDD140 pKa = 3.52QRR142 pKa = 11.84SNLSQEE148 pKa = 4.4IIAEE152 pKa = 4.0HH153 pKa = 6.22LQTLKK158 pKa = 10.54YY159 pKa = 10.21QKK161 pKa = 9.99LAKK164 pKa = 9.67QDD166 pKa = 3.51EE167 pKa = 4.82DD168 pKa = 3.78EE169 pKa = 5.42DD170 pKa = 4.43EE171 pKa = 4.33VDD173 pKa = 4.17EE174 pKa = 5.45LCVICQDD181 pKa = 3.6EE182 pKa = 4.75FKK184 pKa = 10.66SGEE187 pKa = 3.88MLGTLGCRR195 pKa = 11.84HH196 pKa = 6.21EE197 pKa = 4.38FHH199 pKa = 7.39ADD201 pKa = 3.75CITRR205 pKa = 11.84WLQVKK210 pKa = 8.16NVCPICKK217 pKa = 9.79RR218 pKa = 11.84MAVHH222 pKa = 5.98HH223 pKa = 5.61QEE225 pKa = 3.69II226 pKa = 4.17
Molecular weight: 25.92 kDa
Isoelectric point according different methods:
Protein with the highest isoelectric point:
>tr|A0A068UYY0|A0A068UYY0_COFCA Protein kinase domain-containing protein OS=Coffea canephora OX=49390 GN=GSCOC_T00038627001 PE=3 SV=1
MM1 pKa = 6.86LTKK4 pKa = 10.09RR5 pKa = 11.84TINPFFSAKK14 pKa = 9.96IPSNPNAGRR23 pKa = 11.84HH24 pKa = 5.15GRR26 pKa = 11.84LSLKK30 pKa = 10.36FSPRR34 pKa = 11.84THH36 pKa = 6.58HH37 pKa = 6.75PSSLTTPGKK46 pKa = 9.85IGRR49 pKa = 11.84QMQVRR54 pKa = 11.84LEE56 pKa = 3.96AMALSTFRR64 pKa = 11.84PTFHH68 pKa = 6.92QSPPLPTSISISRR81 pKa = 11.84TPSLFLFITRR91 pKa = 11.84NFRR94 pKa = 11.84HH95 pKa = 6.13HH96 pKa = 5.84QWQQQ100 pKa = 2.52
MM1 pKa = 6.86LTKK4 pKa = 10.09RR5 pKa = 11.84TINPFFSAKK14 pKa = 9.96IPSNPNAGRR23 pKa = 11.84HH24 pKa = 5.15GRR26 pKa = 11.84LSLKK30 pKa = 10.36FSPRR34 pKa = 11.84THH36 pKa = 6.58HH37 pKa = 6.75PSSLTTPGKK46 pKa = 9.85IGRR49 pKa = 11.84QMQVRR54 pKa = 11.84LEE56 pKa = 3.96AMALSTFRR64 pKa = 11.84PTFHH68 pKa = 6.92QSPPLPTSISISRR81 pKa = 11.84TPSLFLFITRR91 pKa = 11.84NFRR94 pKa = 11.84HH95 pKa = 6.13HH96 pKa = 5.84QWQQQ100 pKa = 2.52
Molecular weight: 11.46 kDa
Isoelectric point according different methods:
Peptides (in silico digests for buttom-up proteomics)
Below you can find in silico digests of the whole proteome with Trypsin, Chymotrypsin, Trypsin+LysC, LysN, ArgC proteases suitable for different mass spec machines.| Try ESI |
 |
|---|
| ChTry ESI |
 |
|---|
| ArgC ESI |
 |
|---|
| LysN ESI |
 |
|---|
| TryLysC ESI |
 |
|---|
| Try MALDI |
 |
|---|
| ChTry MALDI |
 |
|---|
| ArgC MALDI |
 |
|---|
| LysN MALDI |
 |
|---|
| TryLysC MALDI |
 |
|---|
| Try LTQ |
 |
|---|
| ChTry LTQ |
 |
|---|
| ArgC LTQ |
 |
|---|
| LysN LTQ |
 |
|---|
| TryLysC LTQ |
 |
|---|
| Try MSlow |
 |
|---|
| ChTry MSlow |
 |
|---|
| ArgC MSlow |
 |
|---|
| LysN MSlow |
 |
|---|
| TryLysC MSlow |
 |
|---|
| Try MShigh |
 |
|---|
| ChTry MShigh |
 |
|---|
| ArgC MShigh |
 |
|---|
| LysN MShigh |
 |
|---|
| TryLysC MShigh |
 |
|---|
General Statistics
Number of major isoforms |
Number of additional isoforms |
Number of all proteins |
Number of amino acids |
Min. Seq. Length |
Max. Seq. Length |
Avg. Seq. Length |
Avg. Mol. Weight |
|---|---|---|---|---|---|---|---|
0 |
10225770 |
14 |
5476 |
402.6 |
44.95 |
Amino acid frequency
Ala |
Cys |
Asp |
Glu |
Phe |
Gly |
His |
Ile |
Lys |
Leu |
|---|---|---|---|---|---|---|---|---|---|
6.75 ± 0.014 | 1.942 ± 0.008 |
5.205 ± 0.01 | 6.299 ± 0.016 |
4.361 ± 0.011 | 6.525 ± 0.015 |
2.383 ± 0.006 | 5.484 ± 0.011 |
5.994 ± 0.012 | 10.359 ± 0.022 |
Met |
Asn |
Gln |
Pro |
Arg |
Ser |
Thr |
Val |
Trp |
Tyr |
|---|---|---|---|---|---|---|---|---|---|
2.358 ± 0.006 | 4.437 ± 0.01 |
4.828 ± 0.014 | 3.676 ± 0.011 |
5.22 ± 0.012 | 8.854 ± 0.016 |
4.747 ± 0.008 | 6.406 ± 0.011 |
1.32 ± 0.005 | 2.853 ± 0.009 |
Most of the basic statistics you can see at this page can be downloaded from this CSV file
Proteome-pI is available under Creative Commons Attribution-NoDerivs license, for more details see here
| Reference: Kozlowski LP. Proteome-pI 2.0: Proteome Isoelectric Point Database Update. Nucleic Acids Res. 2021, doi: 10.1093/nar/gkab944 | Contact: Lukasz P. Kozlowski |
