candidate division MSBL1 archaeon SCGC-AAA385D11
Taxonomy: cellular organisms; Archaea; Euryarchaeota; Euryarchaeota incertae sedis; candidate division MSBL1
Average proteome isoelectric point is 6.41
Get precalculated fractions of proteins

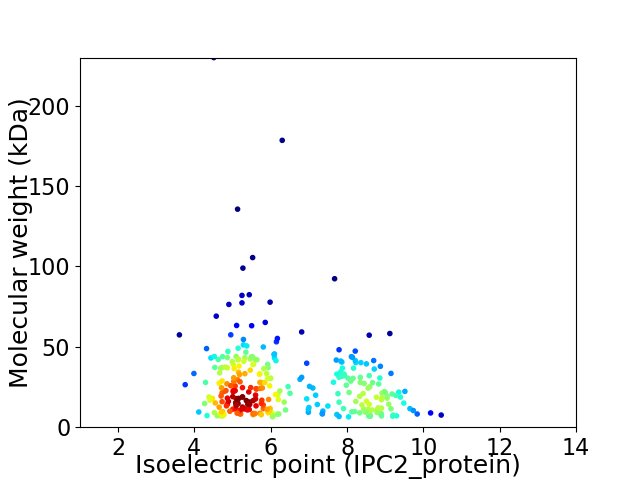
Virtual 2D-PAGE plot for 299 proteins (isoelectric point calculated using IPC2_protein)
Get csv file with sequences according to given criteria:
* You can choose from 21 different methods for calculating isoelectric point
Summary statistics related to proteome-wise predictions


Protein with the lowest isoelectric point:
>tr|A0A133VN62|A0A133VN62_9EURY TDP-4-oxo-6-deoxy-D-glucose aminotransferase OS=candidate division MSBL1 archaeon SCGC-AAA385D11 OX=1698286 GN=AKJ58_01555 PE=3 SV=1
NN1 pKa = 7.87NIVQYY6 pKa = 11.56NNIYY10 pKa = 10.89NNTNNGIQHH19 pKa = 6.72NGTGTLDD26 pKa = 3.15ATYY29 pKa = 10.36NWWGDD34 pKa = 3.37SSGPSGVGPGEE45 pKa = 3.96GDD47 pKa = 3.08AVSEE51 pKa = 4.08NVKK54 pKa = 10.43YY55 pKa = 10.85NPWLLNPFEE64 pKa = 4.68EE65 pKa = 4.55PQTYY69 pKa = 10.16YY70 pKa = 11.09DD71 pKa = 3.35HH72 pKa = 7.53CEE74 pKa = 3.89ALNSGWNLISTPKK87 pKa = 10.21ILEE90 pKa = 4.12NDD92 pKa = 4.73DD93 pKa = 3.43ISEE96 pKa = 4.29MVADD100 pKa = 4.42MDD102 pKa = 4.34NLQHH106 pKa = 6.68VYY108 pKa = 10.01RR109 pKa = 11.84YY110 pKa = 9.19EE111 pKa = 3.81NSGWIEE117 pKa = 3.95DD118 pKa = 3.58NAAYY122 pKa = 9.71GQEE125 pKa = 3.88PLYY128 pKa = 11.22ASFVKK133 pKa = 10.67VKK135 pKa = 10.45EE136 pKa = 4.02EE137 pKa = 4.06AGSIGIGYY145 pKa = 8.68NWSTDD150 pKa = 3.69PQDD153 pKa = 3.68VPPSRR158 pKa = 11.84DD159 pKa = 3.53LPEE162 pKa = 4.39GWSMIGPSIDD172 pKa = 3.59PSVEE176 pKa = 3.63PSVPADD182 pKa = 3.49EE183 pKa = 5.28FLDD186 pKa = 4.03SVSEE190 pKa = 4.38SYY192 pKa = 9.21STLFSPDD199 pKa = 3.12FNLNSWTVTTKK210 pKa = 9.81TAADD214 pKa = 3.71EE215 pKa = 4.14NVLPFEE221 pKa = 4.83GYY223 pKa = 9.03WIFMEE228 pKa = 5.2SLDD231 pKa = 3.96TLAGRR236 pKa = 11.84TTT238 pKa = 3.25
NN1 pKa = 7.87NIVQYY6 pKa = 11.56NNIYY10 pKa = 10.89NNTNNGIQHH19 pKa = 6.72NGTGTLDD26 pKa = 3.15ATYY29 pKa = 10.36NWWGDD34 pKa = 3.37SSGPSGVGPGEE45 pKa = 3.96GDD47 pKa = 3.08AVSEE51 pKa = 4.08NVKK54 pKa = 10.43YY55 pKa = 10.85NPWLLNPFEE64 pKa = 4.68EE65 pKa = 4.55PQTYY69 pKa = 10.16YY70 pKa = 11.09DD71 pKa = 3.35HH72 pKa = 7.53CEE74 pKa = 3.89ALNSGWNLISTPKK87 pKa = 10.21ILEE90 pKa = 4.12NDD92 pKa = 4.73DD93 pKa = 3.43ISEE96 pKa = 4.29MVADD100 pKa = 4.42MDD102 pKa = 4.34NLQHH106 pKa = 6.68VYY108 pKa = 10.01RR109 pKa = 11.84YY110 pKa = 9.19EE111 pKa = 3.81NSGWIEE117 pKa = 3.95DD118 pKa = 3.58NAAYY122 pKa = 9.71GQEE125 pKa = 3.88PLYY128 pKa = 11.22ASFVKK133 pKa = 10.67VKK135 pKa = 10.45EE136 pKa = 4.02EE137 pKa = 4.06AGSIGIGYY145 pKa = 8.68NWSTDD150 pKa = 3.69PQDD153 pKa = 3.68VPPSRR158 pKa = 11.84DD159 pKa = 3.53LPEE162 pKa = 4.39GWSMIGPSIDD172 pKa = 3.59PSVEE176 pKa = 3.63PSVPADD182 pKa = 3.49EE183 pKa = 5.28FLDD186 pKa = 4.03SVSEE190 pKa = 4.38SYY192 pKa = 9.21STLFSPDD199 pKa = 3.12FNLNSWTVTTKK210 pKa = 9.81TAADD214 pKa = 3.71EE215 pKa = 4.14NVLPFEE221 pKa = 4.83GYY223 pKa = 9.03WIFMEE228 pKa = 5.2SLDD231 pKa = 3.96TLAGRR236 pKa = 11.84TTT238 pKa = 3.25
Molecular weight: 26.46 kDa
Isoelectric point according different methods:
Protein with the highest isoelectric point:
>tr|A0A133VNS7|A0A133VNS7_9EURY Uncharacterized protein OS=candidate division MSBL1 archaeon SCGC-AAA385D11 OX=1698286 GN=AKJ58_00915 PE=4 SV=1
MM1 pKa = 6.16MTVDD5 pKa = 3.79VFHH8 pKa = 7.26SKK10 pKa = 10.7DD11 pKa = 3.28DD12 pKa = 3.85SAWCVRR18 pKa = 11.84VRR20 pKa = 11.84SIGQNRR26 pKa = 11.84VVSRR30 pKa = 11.84HH31 pKa = 4.36RR32 pKa = 11.84TKK34 pKa = 10.48KK35 pKa = 9.62AAIRR39 pKa = 11.84RR40 pKa = 11.84AKK42 pKa = 10.47KK43 pKa = 8.73EE44 pKa = 3.78AKK46 pKa = 10.3ALGARR51 pKa = 11.84IDD53 pKa = 3.75VYY55 pKa = 11.32KK56 pKa = 10.71KK57 pKa = 10.6DD58 pKa = 3.42GTLQRR63 pKa = 11.84TLNYY67 pKa = 9.9GWQLL71 pKa = 3.16
MM1 pKa = 6.16MTVDD5 pKa = 3.79VFHH8 pKa = 7.26SKK10 pKa = 10.7DD11 pKa = 3.28DD12 pKa = 3.85SAWCVRR18 pKa = 11.84VRR20 pKa = 11.84SIGQNRR26 pKa = 11.84VVSRR30 pKa = 11.84HH31 pKa = 4.36RR32 pKa = 11.84TKK34 pKa = 10.48KK35 pKa = 9.62AAIRR39 pKa = 11.84RR40 pKa = 11.84AKK42 pKa = 10.47KK43 pKa = 8.73EE44 pKa = 3.78AKK46 pKa = 10.3ALGARR51 pKa = 11.84IDD53 pKa = 3.75VYY55 pKa = 11.32KK56 pKa = 10.71KK57 pKa = 10.6DD58 pKa = 3.42GTLQRR63 pKa = 11.84TLNYY67 pKa = 9.9GWQLL71 pKa = 3.16
Molecular weight: 8.22 kDa
Isoelectric point according different methods:
Peptides (in silico digests for buttom-up proteomics)
Below you can find in silico digests of the whole proteome with Trypsin, Chymotrypsin, Trypsin+LysC, LysN, ArgC proteases suitable for different mass spec machines.| Try ESI |
 |
|---|
| ChTry ESI |
 |
|---|
| ArgC ESI |
 |
|---|
| LysN ESI |
 |
|---|
| TryLysC ESI |
 |
|---|
| Try MALDI |
 |
|---|
| ChTry MALDI |
 |
|---|
| ArgC MALDI |
 |
|---|
| LysN MALDI |
 |
|---|
| TryLysC MALDI |
 |
|---|
| Try LTQ |
 |
|---|
| ChTry LTQ |
 |
|---|
| ArgC LTQ |
 |
|---|
| LysN LTQ |
 |
|---|
| TryLysC LTQ |
 |
|---|
| Try MSlow |
 |
|---|
| ChTry MSlow |
 |
|---|
| ArgC MSlow |
 |
|---|
| LysN MSlow |
 |
|---|
| TryLysC MSlow |
 |
|---|
| Try MShigh |
 |
|---|
| ChTry MShigh |
 |
|---|
| ArgC MShigh |
 |
|---|
| LysN MShigh |
 |
|---|
| TryLysC MShigh |
 |
|---|
General Statistics
Number of major isoforms |
Number of additional isoforms |
Number of all proteins |
Number of amino acids |
Min. Seq. Length |
Max. Seq. Length |
Avg. Seq. Length |
Avg. Mol. Weight |
|---|---|---|---|---|---|---|---|
0 |
72907 |
57 |
2061 |
243.8 |
27.42 |
Amino acid frequency
Ala |
Cys |
Asp |
Glu |
Phe |
Gly |
His |
Ile |
Lys |
Leu |
|---|---|---|---|---|---|---|---|---|---|
6.334 ± 0.168 | 1.167 ± 0.084 |
5.726 ± 0.104 | 9.605 ± 0.217 |
3.788 ± 0.102 | 7.552 ± 0.131 |
1.658 ± 0.063 | 6.835 ± 0.135 |
7.869 ± 0.193 | 8.981 ± 0.197 |
Met |
Asn |
Gln |
Pro |
Arg |
Ser |
Thr |
Val |
Trp |
Tyr |
|---|---|---|---|---|---|---|---|---|---|
2.185 ± 0.068 | 3.797 ± 0.162 |
4.028 ± 0.086 | 2.266 ± 0.065 |
5.935 ± 0.183 | 6.436 ± 0.142 |
4.786 ± 0.236 | 6.984 ± 0.127 |
1.121 ± 0.066 | 2.946 ± 0.133 |
Most of the basic statistics you can see at this page can be downloaded from this CSV file
Proteome-pI is available under Creative Commons Attribution-NoDerivs license, for more details see here
| Reference: Kozlowski LP. Proteome-pI 2.0: Proteome Isoelectric Point Database Update. Nucleic Acids Res. 2021, doi: 10.1093/nar/gkab944 | Contact: Lukasz P. Kozlowski |
