Scheffersomyces stipitis (strain ATCC 58785 / CBS 6054 / NBRC 10063 / NRRL Y-11545) (Yeast) (Pichia stipitis)
Taxonomy: cellular organisms; Eukaryota; Opisthokonta; Fungi; Dikarya; Ascomycota; saccharomyceta; Saccharomycotina; Saccharomycetes; Saccharomycetales; Debaryomycetaceae; Scheffersomyces; Scheffersomyces stipitis
Average proteome isoelectric point is 6.26
Get precalculated fractions of proteins

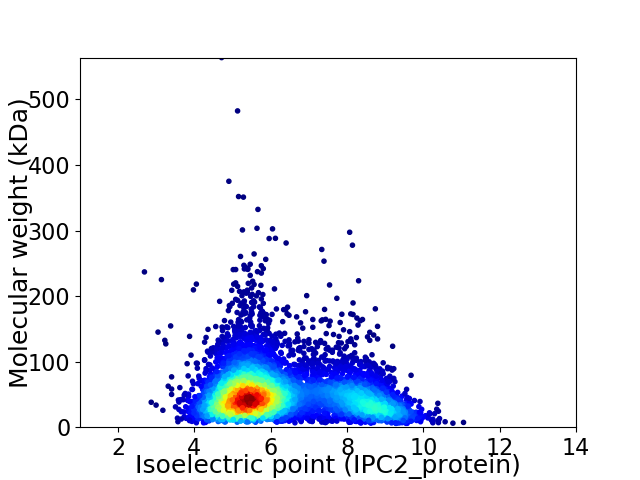
Virtual 2D-PAGE plot for 5797 proteins (isoelectric point calculated using IPC2_protein)
Get csv file with sequences according to given criteria:
* You can choose from 21 different methods for calculating isoelectric point
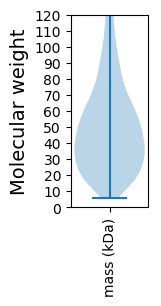
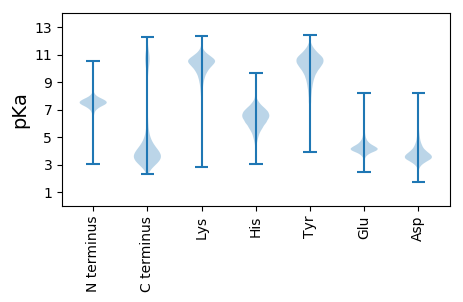
Summary statistics related to proteome-wise predictions


Protein with the lowest isoelectric point:
>tr|A3LZS4|A3LZS4_PICST Uncharacterized protein OS=Scheffersomyces stipitis (strain ATCC 58785 / CBS 6054 / NBRC 10063 / NRRL Y-11545) OX=322104 GN=PICST_33652 PE=4 SV=2
MM1 pKa = 7.7LLFQLIFAATALSSAVNWKK20 pKa = 9.68RR21 pKa = 11.84ASPFGDD27 pKa = 3.2FTGSNCNSACVNAGKK42 pKa = 8.26TLANSCAKK50 pKa = 9.84EE51 pKa = 4.02LQDD54 pKa = 3.22TTDD57 pKa = 3.18YY58 pKa = 11.26VSYY61 pKa = 10.7VKK63 pKa = 10.08CFCNQNSGFWDD74 pKa = 3.57NVAKK78 pKa = 10.42CDD80 pKa = 4.31CADD83 pKa = 3.8GANSGLTGSEE93 pKa = 3.72LRR95 pKa = 11.84AQICEE100 pKa = 3.9DD101 pKa = 3.34SGIFSALSEE110 pKa = 4.22FSDD113 pKa = 4.04LSINFSLTDD122 pKa = 3.81SLDD125 pKa = 3.45LTATNEE131 pKa = 4.12NTDD134 pKa = 3.21ATEE137 pKa = 4.11TNEE140 pKa = 4.28TDD142 pKa = 5.58DD143 pKa = 5.16SDD145 pKa = 4.02TDD147 pKa = 3.67SDD149 pKa = 4.11TGTGTAEE156 pKa = 4.16DD157 pKa = 4.76TDD159 pKa = 4.15TGTSGSGTAKK169 pKa = 10.48SSGSGTKK176 pKa = 10.11DD177 pKa = 2.94SSGSGTTTSTGTSATSGSTTTTRR200 pKa = 11.84TTGTSATSEE209 pKa = 4.47SEE211 pKa = 4.11TSATTNGAKK220 pKa = 10.5GLTCGISLYY229 pKa = 11.0LLALFILL236 pKa = 4.62
MM1 pKa = 7.7LLFQLIFAATALSSAVNWKK20 pKa = 9.68RR21 pKa = 11.84ASPFGDD27 pKa = 3.2FTGSNCNSACVNAGKK42 pKa = 8.26TLANSCAKK50 pKa = 9.84EE51 pKa = 4.02LQDD54 pKa = 3.22TTDD57 pKa = 3.18YY58 pKa = 11.26VSYY61 pKa = 10.7VKK63 pKa = 10.08CFCNQNSGFWDD74 pKa = 3.57NVAKK78 pKa = 10.42CDD80 pKa = 4.31CADD83 pKa = 3.8GANSGLTGSEE93 pKa = 3.72LRR95 pKa = 11.84AQICEE100 pKa = 3.9DD101 pKa = 3.34SGIFSALSEE110 pKa = 4.22FSDD113 pKa = 4.04LSINFSLTDD122 pKa = 3.81SLDD125 pKa = 3.45LTATNEE131 pKa = 4.12NTDD134 pKa = 3.21ATEE137 pKa = 4.11TNEE140 pKa = 4.28TDD142 pKa = 5.58DD143 pKa = 5.16SDD145 pKa = 4.02TDD147 pKa = 3.67SDD149 pKa = 4.11TGTGTAEE156 pKa = 4.16DD157 pKa = 4.76TDD159 pKa = 4.15TGTSGSGTAKK169 pKa = 10.48SSGSGTKK176 pKa = 10.11DD177 pKa = 2.94SSGSGTTTSTGTSATSGSTTTTRR200 pKa = 11.84TTGTSATSEE209 pKa = 4.47SEE211 pKa = 4.11TSATTNGAKK220 pKa = 10.5GLTCGISLYY229 pKa = 11.0LLALFILL236 pKa = 4.62
Molecular weight: 24.04 kDa
Isoelectric point according different methods:
Protein with the highest isoelectric point:
>tr|A3LZG0|A3LZG0_PICST Uncharacterized protein OS=Scheffersomyces stipitis (strain ATCC 58785 / CBS 6054 / NBRC 10063 / NRRL Y-11545) OX=322104 GN=PICST_37052 PE=4 SV=2
SS1 pKa = 7.07SPLQTFMGLVQRR13 pKa = 11.84RR14 pKa = 11.84FKK16 pKa = 11.25SRR18 pKa = 11.84GNTYY22 pKa = 10.24QPSTLKK28 pKa = 10.47RR29 pKa = 11.84KK30 pKa = 8.63RR31 pKa = 11.84TFGFLARR38 pKa = 11.84LRR40 pKa = 11.84TKK42 pKa = 10.4NGRR45 pKa = 11.84KK46 pKa = 8.86ILSRR50 pKa = 11.84RR51 pKa = 11.84KK52 pKa = 10.11AKK54 pKa = 9.98GRR56 pKa = 11.84WYY58 pKa = 9.08LTHH61 pKa = 7.23
SS1 pKa = 7.07SPLQTFMGLVQRR13 pKa = 11.84RR14 pKa = 11.84FKK16 pKa = 11.25SRR18 pKa = 11.84GNTYY22 pKa = 10.24QPSTLKK28 pKa = 10.47RR29 pKa = 11.84KK30 pKa = 8.63RR31 pKa = 11.84TFGFLARR38 pKa = 11.84LRR40 pKa = 11.84TKK42 pKa = 10.4NGRR45 pKa = 11.84KK46 pKa = 8.86ILSRR50 pKa = 11.84RR51 pKa = 11.84KK52 pKa = 10.11AKK54 pKa = 9.98GRR56 pKa = 11.84WYY58 pKa = 9.08LTHH61 pKa = 7.23
Molecular weight: 7.28 kDa
Isoelectric point according different methods:
Peptides (in silico digests for buttom-up proteomics)
Below you can find in silico digests of the whole proteome with Trypsin, Chymotrypsin, Trypsin+LysC, LysN, ArgC proteases suitable for different mass spec machines.| Try ESI |
 |
|---|
| ChTry ESI |
 |
|---|
| ArgC ESI |
 |
|---|
| LysN ESI |
 |
|---|
| TryLysC ESI |
 |
|---|
| Try MALDI |
 |
|---|
| ChTry MALDI |
 |
|---|
| ArgC MALDI |
 |
|---|
| LysN MALDI |
 |
|---|
| TryLysC MALDI |
 |
|---|
| Try LTQ |
 |
|---|
| ChTry LTQ |
 |
|---|
| ArgC LTQ |
 |
|---|
| LysN LTQ |
 |
|---|
| TryLysC LTQ |
 |
|---|
| Try MSlow |
 |
|---|
| ChTry MSlow |
 |
|---|
| ArgC MSlow |
 |
|---|
| LysN MSlow |
 |
|---|
| TryLysC MSlow |
 |
|---|
| Try MShigh |
 |
|---|
| ChTry MShigh |
 |
|---|
| ArgC MShigh |
 |
|---|
| LysN MShigh |
 |
|---|
| TryLysC MShigh |
 |
|---|
General Statistics
Number of major isoforms |
Number of additional isoforms |
Number of all proteins |
Number of amino acids |
Min. Seq. Length |
Max. Seq. Length |
Avg. Seq. Length |
Avg. Mol. Weight |
|---|---|---|---|---|---|---|---|
0 |
2852044 |
49 |
4979 |
492.0 |
55.38 |
Amino acid frequency
Ala |
Cys |
Asp |
Glu |
Phe |
Gly |
His |
Ile |
Lys |
Leu |
|---|---|---|---|---|---|---|---|---|---|
5.88 ± 0.029 | 1.047 ± 0.01 |
5.927 ± 0.024 | 6.64 ± 0.028 |
4.561 ± 0.021 | 5.253 ± 0.031 |
2.116 ± 0.014 | 6.64 ± 0.024 |
6.855 ± 0.028 | 9.423 ± 0.036 |
Met |
Asn |
Gln |
Pro |
Arg |
Ser |
Thr |
Val |
Trp |
Tyr |
|---|---|---|---|---|---|---|---|---|---|
1.779 ± 0.01 | 5.747 ± 0.032 |
4.387 ± 0.029 | 3.81 ± 0.023 |
4.244 ± 0.018 | 9.298 ± 0.042 |
5.687 ± 0.036 | 6.127 ± 0.021 |
1.028 ± 0.009 | 3.551 ± 0.017 |
Most of the basic statistics you can see at this page can be downloaded from this CSV file
Proteome-pI is available under Creative Commons Attribution-NoDerivs license, for more details see here
| Reference: Kozlowski LP. Proteome-pI 2.0: Proteome Isoelectric Point Database Update. Nucleic Acids Res. 2021, doi: 10.1093/nar/gkab944 | Contact: Lukasz P. Kozlowski |
