Gordonibacter urolithinfaciens
Taxonomy: cellular organisms; Bacteria; Terrabacteria group;
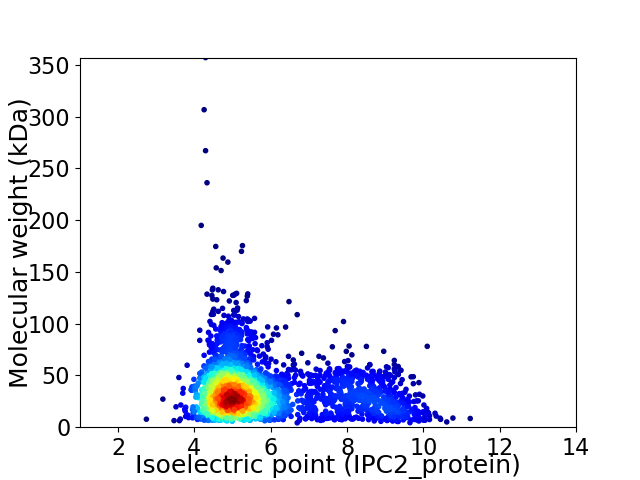
Average proteome isoelectric point is 5.83
Get precalculated fractions of proteins

Virtual 2D-PAGE plot for 2703 proteins (isoelectric point calculated using IPC2_protein)
Get csv file with sequences according to given criteria:
* You can choose from 21 different methods for calculating isoelectric point
Summary statistics related to proteome-wise predictions


Protein with the lowest isoelectric point:
>tr|A0A423UN21|A0A423UN21_9ACTN LysR family transcriptional regulator OS=Gordonibacter urolithinfaciens OX=1335613 GN=DMP12_02610 PE=3 SV=1
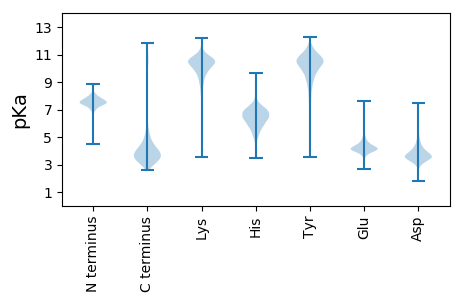
MM1 pKa = 7.56LFFGISNLFSTCSATPTEE19 pKa = 4.41EE20 pKa = 3.98EE21 pKa = 3.9PAAEE25 pKa = 4.94AEE27 pKa = 4.5AEE29 pKa = 4.31SPPTPEE35 pKa = 3.97EE36 pKa = 3.73RR37 pKa = 11.84LAALPAVEE45 pKa = 4.53TGLAEE50 pKa = 4.8LDD52 pKa = 4.15LPTGTEE58 pKa = 3.93PQAFAPAPAEE68 pKa = 4.14GSAVAVQPVLSDD80 pKa = 3.38ASKK83 pKa = 10.93AAIDD87 pKa = 3.44QAFAPFAEE95 pKa = 4.4NDD97 pKa = 3.37RR98 pKa = 11.84SFGFALVDD106 pKa = 4.12LGTGRR111 pKa = 11.84GIASNVDD118 pKa = 2.95AVFYY122 pKa = 10.33GASSFKK128 pKa = 10.85GPYY131 pKa = 9.04CVYY134 pKa = 10.06FCQSQLEE141 pKa = 4.51TGLATRR147 pKa = 11.84DD148 pKa = 3.68DD149 pKa = 4.29FVTSGFMSEE158 pKa = 4.21SGVFSSQGSEE168 pKa = 4.65LIGSMIEE175 pKa = 4.03SAILFSSNDD184 pKa = 3.12TYY186 pKa = 11.66GALRR190 pKa = 11.84YY191 pKa = 9.96DD192 pKa = 3.96YY193 pKa = 11.42SDD195 pKa = 4.33DD196 pKa = 3.78ALAAYY201 pKa = 10.51LEE203 pKa = 4.4GLGVDD208 pKa = 3.61PALAYY213 pKa = 7.76DD214 pKa = 3.57TWFPHH219 pKa = 4.22YY220 pKa = 8.51TVRR223 pKa = 11.84DD224 pKa = 4.09GVRR227 pKa = 11.84LWPNASEE234 pKa = 4.15YY235 pKa = 10.48LASGTEE241 pKa = 4.04TAQWLAGLLEE251 pKa = 4.46RR252 pKa = 11.84DD253 pKa = 3.19EE254 pKa = 4.35TSYY257 pKa = 11.25LRR259 pKa = 11.84EE260 pKa = 3.92ALKK263 pKa = 11.02DD264 pKa = 3.26EE265 pKa = 4.62GVQVQSKK272 pKa = 9.09PGWSMEE278 pKa = 3.94SFEE281 pKa = 4.24NGEE284 pKa = 4.08YY285 pKa = 10.54NALCDD290 pKa = 3.95AGIVAKK296 pKa = 10.46DD297 pKa = 3.2GRR299 pKa = 11.84RR300 pKa = 11.84YY301 pKa = 9.82LVSVMSNIPYY311 pKa = 6.99TTSNVDD317 pKa = 3.35LFEE320 pKa = 4.92DD321 pKa = 4.05VIAAVFAARR330 pKa = 11.84GDD332 pKa = 3.87LAA334 pKa = 5.89
MM1 pKa = 7.56LFFGISNLFSTCSATPTEE19 pKa = 4.41EE20 pKa = 3.98EE21 pKa = 3.9PAAEE25 pKa = 4.94AEE27 pKa = 4.5AEE29 pKa = 4.31SPPTPEE35 pKa = 3.97EE36 pKa = 3.73RR37 pKa = 11.84LAALPAVEE45 pKa = 4.53TGLAEE50 pKa = 4.8LDD52 pKa = 4.15LPTGTEE58 pKa = 3.93PQAFAPAPAEE68 pKa = 4.14GSAVAVQPVLSDD80 pKa = 3.38ASKK83 pKa = 10.93AAIDD87 pKa = 3.44QAFAPFAEE95 pKa = 4.4NDD97 pKa = 3.37RR98 pKa = 11.84SFGFALVDD106 pKa = 4.12LGTGRR111 pKa = 11.84GIASNVDD118 pKa = 2.95AVFYY122 pKa = 10.33GASSFKK128 pKa = 10.85GPYY131 pKa = 9.04CVYY134 pKa = 10.06FCQSQLEE141 pKa = 4.51TGLATRR147 pKa = 11.84DD148 pKa = 3.68DD149 pKa = 4.29FVTSGFMSEE158 pKa = 4.21SGVFSSQGSEE168 pKa = 4.65LIGSMIEE175 pKa = 4.03SAILFSSNDD184 pKa = 3.12TYY186 pKa = 11.66GALRR190 pKa = 11.84YY191 pKa = 9.96DD192 pKa = 3.96YY193 pKa = 11.42SDD195 pKa = 4.33DD196 pKa = 3.78ALAAYY201 pKa = 10.51LEE203 pKa = 4.4GLGVDD208 pKa = 3.61PALAYY213 pKa = 7.76DD214 pKa = 3.57TWFPHH219 pKa = 4.22YY220 pKa = 8.51TVRR223 pKa = 11.84DD224 pKa = 4.09GVRR227 pKa = 11.84LWPNASEE234 pKa = 4.15YY235 pKa = 10.48LASGTEE241 pKa = 4.04TAQWLAGLLEE251 pKa = 4.46RR252 pKa = 11.84DD253 pKa = 3.19EE254 pKa = 4.35TSYY257 pKa = 11.25LRR259 pKa = 11.84EE260 pKa = 3.92ALKK263 pKa = 11.02DD264 pKa = 3.26EE265 pKa = 4.62GVQVQSKK272 pKa = 9.09PGWSMEE278 pKa = 3.94SFEE281 pKa = 4.24NGEE284 pKa = 4.08YY285 pKa = 10.54NALCDD290 pKa = 3.95AGIVAKK296 pKa = 10.46DD297 pKa = 3.2GRR299 pKa = 11.84RR300 pKa = 11.84YY301 pKa = 9.82LVSVMSNIPYY311 pKa = 6.99TTSNVDD317 pKa = 3.35LFEE320 pKa = 4.92DD321 pKa = 4.05VIAAVFAARR330 pKa = 11.84GDD332 pKa = 3.87LAA334 pKa = 5.89
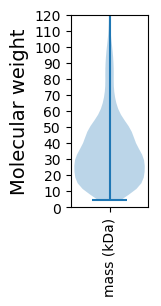
Molecular weight: 35.65 kDa
Isoelectric point according different methods:
Protein with the highest isoelectric point:
>tr|A0A423UM63|A0A423UM63_9ACTN Na(+)/H(+) antiporter NhaA OS=Gordonibacter urolithinfaciens OX=1335613 GN=nhaA PE=3 SV=1
MM1 pKa = 7.07VRR3 pKa = 11.84RR4 pKa = 11.84RR5 pKa = 11.84PPLSRR10 pKa = 11.84NRR12 pKa = 11.84SGPPSKK18 pKa = 10.22RR19 pKa = 11.84ARR21 pKa = 11.84SSRR24 pKa = 11.84KK25 pKa = 8.93RR26 pKa = 11.84VPSRR30 pKa = 11.84LRR32 pKa = 11.84RR33 pKa = 11.84PKK35 pKa = 10.69APSPLPARR43 pKa = 11.84QPRR46 pKa = 11.84PSRR49 pKa = 11.84PSRR52 pKa = 11.84PIWRR56 pKa = 11.84RR57 pKa = 11.84SMEE60 pKa = 4.18LPRR63 pKa = 11.84GASTRR68 pKa = 11.84RR69 pKa = 11.84SPRR72 pKa = 3.06
MM1 pKa = 7.07VRR3 pKa = 11.84RR4 pKa = 11.84RR5 pKa = 11.84PPLSRR10 pKa = 11.84NRR12 pKa = 11.84SGPPSKK18 pKa = 10.22RR19 pKa = 11.84ARR21 pKa = 11.84SSRR24 pKa = 11.84KK25 pKa = 8.93RR26 pKa = 11.84VPSRR30 pKa = 11.84LRR32 pKa = 11.84RR33 pKa = 11.84PKK35 pKa = 10.69APSPLPARR43 pKa = 11.84QPRR46 pKa = 11.84PSRR49 pKa = 11.84PSRR52 pKa = 11.84PIWRR56 pKa = 11.84RR57 pKa = 11.84SMEE60 pKa = 4.18LPRR63 pKa = 11.84GASTRR68 pKa = 11.84RR69 pKa = 11.84SPRR72 pKa = 3.06
Molecular weight: 8.42 kDa
Isoelectric point according different methods:
Peptides (in silico digests for buttom-up proteomics)
Below you can find in silico digests of the whole proteome with Trypsin, Chymotrypsin, Trypsin+LysC, LysN, ArgC proteases suitable for different mass spec machines.| Try ESI |
 |
|---|
| ChTry ESI |
 |
|---|
| ArgC ESI |
 |
|---|
| LysN ESI |
 |
|---|
| TryLysC ESI |
 |
|---|
| Try MALDI |
 |
|---|
| ChTry MALDI |
 |
|---|
| ArgC MALDI |
 |
|---|
| LysN MALDI |
 |
|---|
| TryLysC MALDI |
 |
|---|
| Try LTQ |
 |
|---|
| ChTry LTQ |
 |
|---|
| ArgC LTQ |
 |
|---|
| LysN LTQ |
 |
|---|
| TryLysC LTQ |
 |
|---|
| Try MSlow |
 |
|---|
| ChTry MSlow |
 |
|---|
| ArgC MSlow |
 |
|---|
| LysN MSlow |
 |
|---|
| TryLysC MSlow |
 |
|---|
| Try MShigh |
 |
|---|
| ChTry MShigh |
 |
|---|
| ArgC MShigh |
 |
|---|
| LysN MShigh |
 |
|---|
| TryLysC MShigh |
 |
|---|
General Statistics
Number of major isoforms |
Number of additional isoforms |
Number of all proteins |
Number of amino acids |
Min. Seq. Length |
Max. Seq. Length |
Avg. Seq. Length |
Avg. Mol. Weight |
|---|---|---|---|---|---|---|---|
0 |
921810 |
37 |
3347 |
341.0 |
36.9 |
Amino acid frequency
Ala |
Cys |
Asp |
Glu |
Phe |
Gly |
His |
Ile |
Lys |
Leu |
|---|---|---|---|---|---|---|---|---|---|
12.755 ± 0.074 | 1.615 ± 0.027 |
6.005 ± 0.041 | 6.539 ± 0.043 |
3.89 ± 0.036 | 8.67 ± 0.043 |
1.751 ± 0.018 | 4.39 ± 0.038 |
3.543 ± 0.04 | 9.507 ± 0.056 |
Met |
Asn |
Gln |
Pro |
Arg |
Ser |
Thr |
Val |
Trp |
Tyr |
|---|---|---|---|---|---|---|---|---|---|
2.531 ± 0.026 | 2.609 ± 0.028 |
4.702 ± 0.033 | 2.718 ± 0.027 |
6.236 ± 0.048 | 5.333 ± 0.04 |
4.952 ± 0.043 | 8.255 ± 0.048 |
1.16 ± 0.022 | 2.838 ± 0.03 |
Most of the basic statistics you can see at this page can be downloaded from this CSV file
Proteome-pI is available under Creative Commons Attribution-NoDerivs license, for more details see here
| Reference: Kozlowski LP. Proteome-pI 2.0: Proteome Isoelectric Point Database Update. Nucleic Acids Res. 2021, doi: 10.1093/nar/gkab944 | Contact: Lukasz P. Kozlowski |
