Verruconis gallopava
Taxonomy: cellular organisms; Eukaryota; Opisthokonta; Fungi; Dikarya; Ascomycota; saccharomyceta; Pezizomycotina; leotiomyceta; dothideomyceta; Dothideomycetes; Pleosporomycetidae;
Average proteome isoelectric point is 6.68
Get precalculated fractions of proteins

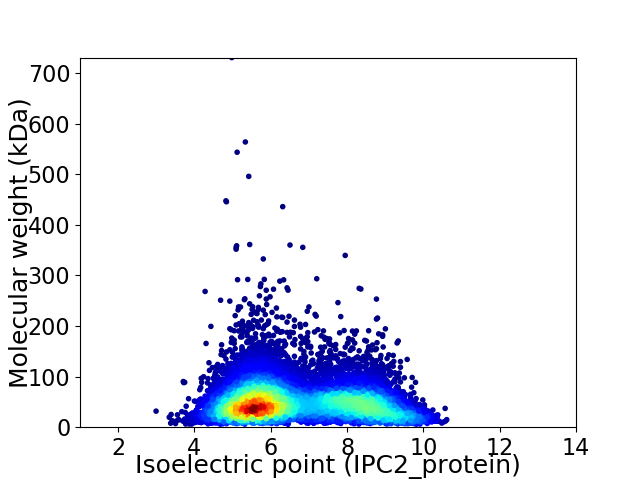
Virtual 2D-PAGE plot for 10768 proteins (isoelectric point calculated using IPC2_protein)
Get csv file with sequences according to given criteria:
* You can choose from 21 different methods for calculating isoelectric point
Summary statistics related to proteome-wise predictions


Protein with the lowest isoelectric point:
>tr|A0A0D1YJZ4|A0A0D1YJZ4_9PEZI 2-(3-amino-3-carboxypropyl)histidine synthase subunit 1 OS=Verruconis gallopava OX=253628 GN=PV09_07469 PE=3 SV=1
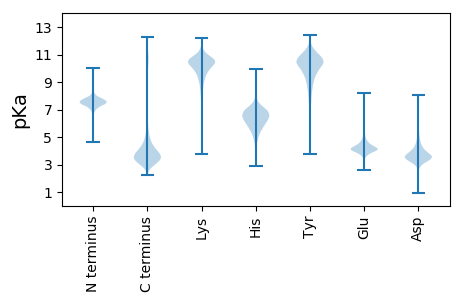
MM1 pKa = 7.38YY2 pKa = 9.13MLKK5 pKa = 10.31SVVSIALFTAYY16 pKa = 10.19AIAQSTLQFTSTPQTVQAGQSYY38 pKa = 7.98TLTWTGGDD46 pKa = 3.18STQPVTILLRR56 pKa = 11.84NGDD59 pKa = 4.04PSDD62 pKa = 3.66LQTIGTLTTTATGGSFTWTVDD83 pKa = 3.3PSIADD88 pKa = 3.45SNQYY92 pKa = 10.79AFEE95 pKa = 4.13IVQGSEE101 pKa = 4.08TNYY104 pKa = 10.47SNQFTVTGGSGTLSSATGTATISASASASASASAAASTTEE144 pKa = 4.14SSSGTSSTTEE154 pKa = 3.75SSSASASASSTTLSSAAASTTSTTSSAKK182 pKa = 9.75TSATAATSAPSSGASGLQSPIALILGAVAAMLSFAA217 pKa = 5.1
MM1 pKa = 7.38YY2 pKa = 9.13MLKK5 pKa = 10.31SVVSIALFTAYY16 pKa = 10.19AIAQSTLQFTSTPQTVQAGQSYY38 pKa = 7.98TLTWTGGDD46 pKa = 3.18STQPVTILLRR56 pKa = 11.84NGDD59 pKa = 4.04PSDD62 pKa = 3.66LQTIGTLTTTATGGSFTWTVDD83 pKa = 3.3PSIADD88 pKa = 3.45SNQYY92 pKa = 10.79AFEE95 pKa = 4.13IVQGSEE101 pKa = 4.08TNYY104 pKa = 10.47SNQFTVTGGSGTLSSATGTATISASASASASASAAASTTEE144 pKa = 4.14SSSGTSSTTEE154 pKa = 3.75SSSASASASSTTLSSAAASTTSTTSSAKK182 pKa = 9.75TSATAATSAPSSGASGLQSPIALILGAVAAMLSFAA217 pKa = 5.1
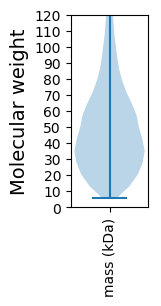
Molecular weight: 21.27 kDa
Isoelectric point according different methods:
Protein with the highest isoelectric point:
>tr|A0A0D1X935|A0A0D1X935_9PEZI Uncharacterized protein OS=Verruconis gallopava OX=253628 GN=PV09_09619 PE=3 SV=1
MM1 pKa = 8.03AIPEE5 pKa = 4.25TRR7 pKa = 11.84RR8 pKa = 11.84KK9 pKa = 10.03FPGHH13 pKa = 5.42QLLSRR18 pKa = 11.84FNNVLHH24 pKa = 6.33QYY26 pKa = 7.6EE27 pKa = 4.06ICHH30 pKa = 5.88RR31 pKa = 11.84QFPDD35 pKa = 3.31GRR37 pKa = 11.84SSGLLPDD44 pKa = 3.6WLDD47 pKa = 3.3ITGTNAKK54 pKa = 10.07FGGWNTTPSNAFWSSGDD71 pKa = 3.55LDD73 pKa = 3.52PWRR76 pKa = 11.84SQTVFSEE83 pKa = 4.69QPSSPQYY90 pKa = 10.91KK91 pKa = 7.77ITQNIRR97 pKa = 11.84ACGQSSRR104 pKa = 11.84NAKK107 pKa = 10.47DD108 pKa = 3.81EE109 pKa = 4.1IFGPLCRR116 pKa = 11.84STLLISFHH124 pKa = 6.65RR125 pKa = 11.84FRR127 pKa = 11.84PVHH130 pKa = 6.01RR131 pKa = 11.84RR132 pKa = 11.84RR133 pKa = 11.84IFGRR137 pKa = 11.84EE138 pKa = 3.26RR139 pKa = 11.84WKK141 pKa = 11.01NGCDD145 pKa = 5.09AGSLWQTEE153 pKa = 4.1SRR155 pKa = 11.84KK156 pKa = 9.9RR157 pKa = 11.84RR158 pKa = 11.84VSQKK162 pKa = 9.13VAIYY166 pKa = 10.51
MM1 pKa = 8.03AIPEE5 pKa = 4.25TRR7 pKa = 11.84RR8 pKa = 11.84KK9 pKa = 10.03FPGHH13 pKa = 5.42QLLSRR18 pKa = 11.84FNNVLHH24 pKa = 6.33QYY26 pKa = 7.6EE27 pKa = 4.06ICHH30 pKa = 5.88RR31 pKa = 11.84QFPDD35 pKa = 3.31GRR37 pKa = 11.84SSGLLPDD44 pKa = 3.6WLDD47 pKa = 3.3ITGTNAKK54 pKa = 10.07FGGWNTTPSNAFWSSGDD71 pKa = 3.55LDD73 pKa = 3.52PWRR76 pKa = 11.84SQTVFSEE83 pKa = 4.69QPSSPQYY90 pKa = 10.91KK91 pKa = 7.77ITQNIRR97 pKa = 11.84ACGQSSRR104 pKa = 11.84NAKK107 pKa = 10.47DD108 pKa = 3.81EE109 pKa = 4.1IFGPLCRR116 pKa = 11.84STLLISFHH124 pKa = 6.65RR125 pKa = 11.84FRR127 pKa = 11.84PVHH130 pKa = 6.01RR131 pKa = 11.84RR132 pKa = 11.84RR133 pKa = 11.84IFGRR137 pKa = 11.84EE138 pKa = 3.26RR139 pKa = 11.84WKK141 pKa = 11.01NGCDD145 pKa = 5.09AGSLWQTEE153 pKa = 4.1SRR155 pKa = 11.84KK156 pKa = 9.9RR157 pKa = 11.84RR158 pKa = 11.84VSQKK162 pKa = 9.13VAIYY166 pKa = 10.51
Molecular weight: 19.27 kDa
Isoelectric point according different methods:
Peptides (in silico digests for buttom-up proteomics)
Below you can find in silico digests of the whole proteome with Trypsin, Chymotrypsin, Trypsin+LysC, LysN, ArgC proteases suitable for different mass spec machines.| Try ESI |
 |
|---|
| ChTry ESI |
 |
|---|
| ArgC ESI |
 |
|---|
| LysN ESI |
 |
|---|
| TryLysC ESI |
 |
|---|
| Try MALDI |
 |
|---|
| ChTry MALDI |
 |
|---|
| ArgC MALDI |
 |
|---|
| LysN MALDI |
 |
|---|
| TryLysC MALDI |
 |
|---|
| Try LTQ |
 |
|---|
| ChTry LTQ |
 |
|---|
| ArgC LTQ |
 |
|---|
| LysN LTQ |
 |
|---|
| TryLysC LTQ |
 |
|---|
| Try MSlow |
 |
|---|
| ChTry MSlow |
 |
|---|
| ArgC MSlow |
 |
|---|
| LysN MSlow |
 |
|---|
| TryLysC MSlow |
 |
|---|
| Try MShigh |
 |
|---|
| ChTry MShigh |
 |
|---|
| ArgC MShigh |
 |
|---|
| LysN MShigh |
 |
|---|
| TryLysC MShigh |
 |
|---|
General Statistics
Number of major isoforms |
Number of additional isoforms |
Number of all proteins |
Number of amino acids |
Min. Seq. Length |
Max. Seq. Length |
Avg. Seq. Length |
Avg. Mol. Weight |
|---|---|---|---|---|---|---|---|
5262068 |
51 |
6703 |
488.7 |
54.21 |
Amino acid frequency
Ala |
Cys |
Asp |
Glu |
Phe |
Gly |
His |
Ile |
Lys |
Leu |
|---|---|---|---|---|---|---|---|---|---|
8.731 ± 0.019 | 1.23 ± 0.01 |
5.62 ± 0.017 | 6.337 ± 0.021 |
3.698 ± 0.014 | 6.621 ± 0.021 |
2.367 ± 0.01 | 4.926 ± 0.016 |
5.171 ± 0.022 | 8.811 ± 0.023 |
Met |
Asn |
Gln |
Pro |
Arg |
Ser |
Thr |
Val |
Trp |
Tyr |
|---|---|---|---|---|---|---|---|---|---|
2.229 ± 0.008 | 3.716 ± 0.011 |
5.866 ± 0.023 | 4.026 ± 0.015 |
6.294 ± 0.021 | 8.335 ± 0.029 |
5.774 ± 0.013 | 6.048 ± 0.014 |
1.438 ± 0.009 | 2.76 ± 0.012 |
Most of the basic statistics you can see at this page can be downloaded from this CSV file
Proteome-pI is available under Creative Commons Attribution-NoDerivs license, for more details see here
| Reference: Kozlowski LP. Proteome-pI 2.0: Proteome Isoelectric Point Database Update. Nucleic Acids Res. 2021, doi: 10.1093/nar/gkab944 | Contact: Lukasz P. Kozlowski |
