Dechloromonas sp. HYN0024
Taxonomy: cellular organisms; Bacteria; Proteobacteria; Betaproteobacteria; Rhodocyclales; Azonexaceae; Dechloromonas; unclassified Dechloromonas
Average proteome isoelectric point is 6.54
Get precalculated fractions of proteins

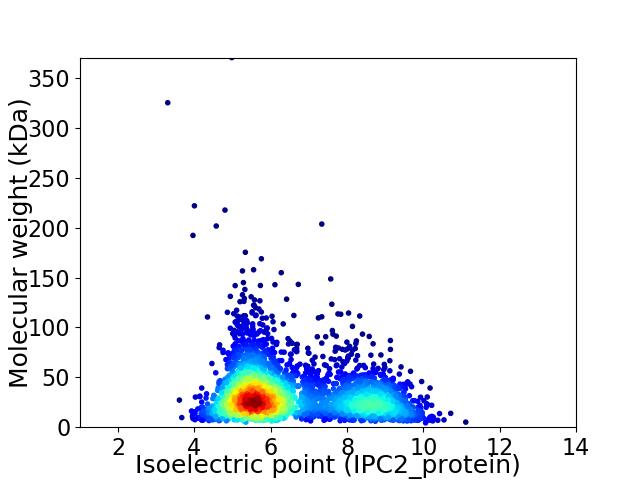
Virtual 2D-PAGE plot for 3011 proteins (isoelectric point calculated using IPC2_protein)
Get csv file with sequences according to given criteria:
* You can choose from 21 different methods for calculating isoelectric point
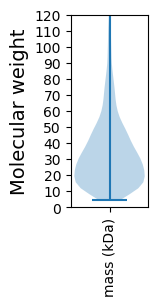
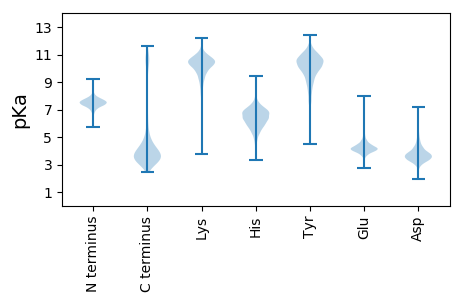
Summary statistics related to proteome-wise predictions


Protein with the lowest isoelectric point:
>tr|A0A3B7A1C3|A0A3B7A1C3_9RHOO Adenine DNA glycosylase OS=Dechloromonas sp. HYN0024 OX=2231055 GN=mutY PE=3 SV=1
MM1 pKa = 7.11QSWSGNDD8 pKa = 3.14IIYY11 pKa = 10.62GNSGDD16 pKa = 4.61DD17 pKa = 3.63VLKK20 pKa = 11.12GGAGDD25 pKa = 4.53DD26 pKa = 4.37YY27 pKa = 11.39IDD29 pKa = 4.35GGLGIDD35 pKa = 3.51QSVYY39 pKa = 10.22SANSSSVSLVRR50 pKa = 11.84HH51 pKa = 5.91LKK53 pKa = 10.54AGGVLLEE60 pKa = 4.28SAEE63 pKa = 4.35GSDD66 pKa = 3.1TLVNVEE72 pKa = 3.88QVQFNDD78 pKa = 3.48GTFNLEE84 pKa = 3.73SFIRR88 pKa = 11.84SIPTPSYY95 pKa = 8.33TTDD98 pKa = 3.42AGNATPTVYY107 pKa = 10.49SGAVGFLEE115 pKa = 4.36FQFLGGAVGEE125 pKa = 4.12IVIGSKK131 pKa = 11.17YY132 pKa = 10.61NDD134 pKa = 4.68FINLLAGDD142 pKa = 4.58DD143 pKa = 4.04AADD146 pKa = 3.89GAGGDD151 pKa = 4.15DD152 pKa = 4.13VLDD155 pKa = 4.17GGIGSNFLTGGAGKK169 pKa = 8.6DD170 pKa = 3.28TFFLDD175 pKa = 3.59GRR177 pKa = 11.84GGSVTWSTITDD188 pKa = 4.2FEE190 pKa = 6.53AGDD193 pKa = 3.77QVNIWGWQPNVSKK206 pKa = 11.06LLLTQASAGASGFSGATYY224 pKa = 9.88HH225 pKa = 7.2YY226 pKa = 10.48DD227 pKa = 3.49LNNDD231 pKa = 3.19GSIDD235 pKa = 3.65TSITFAVLALSAVPSPVPSDD255 pKa = 3.59VAGNGYY261 pKa = 9.99LLFGG265 pKa = 4.48
MM1 pKa = 7.11QSWSGNDD8 pKa = 3.14IIYY11 pKa = 10.62GNSGDD16 pKa = 4.61DD17 pKa = 3.63VLKK20 pKa = 11.12GGAGDD25 pKa = 4.53DD26 pKa = 4.37YY27 pKa = 11.39IDD29 pKa = 4.35GGLGIDD35 pKa = 3.51QSVYY39 pKa = 10.22SANSSSVSLVRR50 pKa = 11.84HH51 pKa = 5.91LKK53 pKa = 10.54AGGVLLEE60 pKa = 4.28SAEE63 pKa = 4.35GSDD66 pKa = 3.1TLVNVEE72 pKa = 3.88QVQFNDD78 pKa = 3.48GTFNLEE84 pKa = 3.73SFIRR88 pKa = 11.84SIPTPSYY95 pKa = 8.33TTDD98 pKa = 3.42AGNATPTVYY107 pKa = 10.49SGAVGFLEE115 pKa = 4.36FQFLGGAVGEE125 pKa = 4.12IVIGSKK131 pKa = 11.17YY132 pKa = 10.61NDD134 pKa = 4.68FINLLAGDD142 pKa = 4.58DD143 pKa = 4.04AADD146 pKa = 3.89GAGGDD151 pKa = 4.15DD152 pKa = 4.13VLDD155 pKa = 4.17GGIGSNFLTGGAGKK169 pKa = 8.6DD170 pKa = 3.28TFFLDD175 pKa = 3.59GRR177 pKa = 11.84GGSVTWSTITDD188 pKa = 4.2FEE190 pKa = 6.53AGDD193 pKa = 3.77QVNIWGWQPNVSKK206 pKa = 11.06LLLTQASAGASGFSGATYY224 pKa = 9.88HH225 pKa = 7.2YY226 pKa = 10.48DD227 pKa = 3.49LNNDD231 pKa = 3.19GSIDD235 pKa = 3.65TSITFAVLALSAVPSPVPSDD255 pKa = 3.59VAGNGYY261 pKa = 9.99LLFGG265 pKa = 4.48
Molecular weight: 27.19 kDa
Isoelectric point according different methods:
Protein with the highest isoelectric point:
>tr|A0A3B7A917|A0A3B7A917_9RHOO P-II family nitrogen regulator OS=Dechloromonas sp. HYN0024 OX=2231055 GN=HYN24_01465 PE=4 SV=1
MM1 pKa = 7.35KK2 pKa = 9.36RR3 pKa = 11.84TYY5 pKa = 9.97QPSVVRR11 pKa = 11.84RR12 pKa = 11.84KK13 pKa = 8.6RR14 pKa = 11.84THH16 pKa = 5.72GFLVRR21 pKa = 11.84MRR23 pKa = 11.84TKK25 pKa = 10.53GGRR28 pKa = 11.84AVIAARR34 pKa = 11.84RR35 pKa = 11.84AKK37 pKa = 10.38GRR39 pKa = 11.84TRR41 pKa = 11.84LAVV44 pKa = 3.19
MM1 pKa = 7.35KK2 pKa = 9.36RR3 pKa = 11.84TYY5 pKa = 9.97QPSVVRR11 pKa = 11.84RR12 pKa = 11.84KK13 pKa = 8.6RR14 pKa = 11.84THH16 pKa = 5.72GFLVRR21 pKa = 11.84MRR23 pKa = 11.84TKK25 pKa = 10.53GGRR28 pKa = 11.84AVIAARR34 pKa = 11.84RR35 pKa = 11.84AKK37 pKa = 10.38GRR39 pKa = 11.84TRR41 pKa = 11.84LAVV44 pKa = 3.19
Molecular weight: 5.09 kDa
Isoelectric point according different methods:
Peptides (in silico digests for buttom-up proteomics)
Below you can find in silico digests of the whole proteome with Trypsin, Chymotrypsin, Trypsin+LysC, LysN, ArgC proteases suitable for different mass spec machines.| Try ESI |
 |
|---|
| ChTry ESI |
 |
|---|
| ArgC ESI |
 |
|---|
| LysN ESI |
 |
|---|
| TryLysC ESI |
 |
|---|
| Try MALDI |
 |
|---|
| ChTry MALDI |
 |
|---|
| ArgC MALDI |
 |
|---|
| LysN MALDI |
 |
|---|
| TryLysC MALDI |
 |
|---|
| Try LTQ |
 |
|---|
| ChTry LTQ |
 |
|---|
| ArgC LTQ |
 |
|---|
| LysN LTQ |
 |
|---|
| TryLysC LTQ |
 |
|---|
| Try MSlow |
 |
|---|
| ChTry MSlow |
 |
|---|
| ArgC MSlow |
 |
|---|
| LysN MSlow |
 |
|---|
| TryLysC MSlow |
 |
|---|
| Try MShigh |
 |
|---|
| ChTry MShigh |
 |
|---|
| ArgC MShigh |
 |
|---|
| LysN MShigh |
 |
|---|
| TryLysC MShigh |
 |
|---|
General Statistics
Number of major isoforms |
Number of additional isoforms |
Number of all proteins |
Number of amino acids |
Min. Seq. Length |
Max. Seq. Length |
Avg. Seq. Length |
Avg. Mol. Weight |
|---|---|---|---|---|---|---|---|
0 |
978272 |
37 |
3669 |
324.9 |
35.47 |
Amino acid frequency
Ala |
Cys |
Asp |
Glu |
Phe |
Gly |
His |
Ile |
Lys |
Leu |
|---|---|---|---|---|---|---|---|---|---|
11.514 ± 0.056 | 1.052 ± 0.019 |
5.445 ± 0.033 | 5.791 ± 0.042 |
3.738 ± 0.027 | 8.064 ± 0.049 |
2.208 ± 0.022 | 5.428 ± 0.036 |
4.11 ± 0.042 | 10.681 ± 0.067 |
Met |
Asn |
Gln |
Pro |
Arg |
Ser |
Thr |
Val |
Trp |
Tyr |
|---|---|---|---|---|---|---|---|---|---|
2.562 ± 0.024 | 3.118 ± 0.031 |
4.808 ± 0.035 | 3.723 ± 0.03 |
6.223 ± 0.048 | 5.541 ± 0.04 |
5.146 ± 0.062 | 7.211 ± 0.049 |
1.31 ± 0.02 | 2.327 ± 0.022 |
Most of the basic statistics you can see at this page can be downloaded from this CSV file
Proteome-pI is available under Creative Commons Attribution-NoDerivs license, for more details see here
| Reference: Kozlowski LP. Proteome-pI 2.0: Proteome Isoelectric Point Database Update. Nucleic Acids Res. 2021, doi: 10.1093/nar/gkab944 | Contact: Lukasz P. Kozlowski |
