Firmicutes bacterium CAG:238
Taxonomy: cellular organisms; Bacteria; Terrabacteria group; Firmicutes; environmental samples
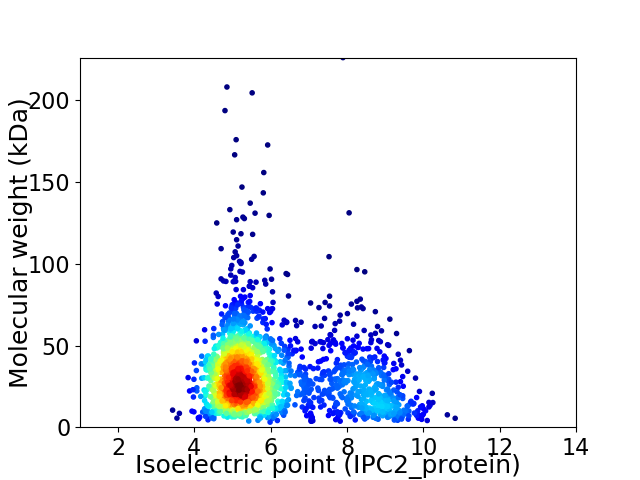
Average proteome isoelectric point is 6.08
Get precalculated fractions of proteins

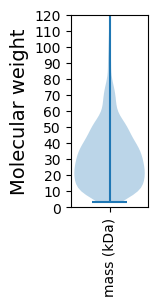
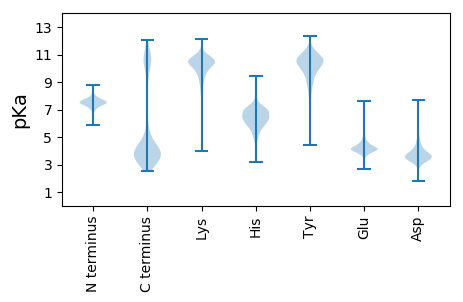
Virtual 2D-PAGE plot for 2016 proteins (isoelectric point calculated using IPC2_protein)
Get csv file with sequences according to given criteria:
* You can choose from 21 different methods for calculating isoelectric point
Summary statistics related to proteome-wise predictions


Protein with the lowest isoelectric point:
>tr|R6E2C0|R6E2C0_9FIRM Sporulation stage V protein AE OS=Firmicutes bacterium CAG:238 OX=1263011 GN=BN553_01677 PE=4 SV=1
MM1 pKa = 7.59NKK3 pKa = 9.78RR4 pKa = 11.84EE5 pKa = 4.41LYY7 pKa = 10.61ALLDD11 pKa = 3.52IEE13 pKa = 4.5SPEE16 pKa = 3.72EE17 pKa = 3.79FEE19 pKa = 4.67YY20 pKa = 11.19FEE22 pKa = 4.71NLADD26 pKa = 3.78YY27 pKa = 10.5LEE29 pKa = 5.01CEE31 pKa = 4.3EE32 pKa = 4.52EE33 pKa = 4.49LDD35 pKa = 3.93YY36 pKa = 11.7TDD38 pKa = 4.09VAEE41 pKa = 5.3LFNGVNKK48 pKa = 10.48DD49 pKa = 3.7VLAQLCDD56 pKa = 3.35NYY58 pKa = 10.76FEE60 pKa = 5.16EE61 pKa = 5.12ISGFVPGSQTEE72 pKa = 4.17VFTIFEE78 pKa = 4.54NIRR81 pKa = 11.84RR82 pKa = 11.84ALVGMCRR89 pKa = 11.84NCSDD93 pKa = 5.19DD94 pKa = 4.35EE95 pKa = 4.17NLEE98 pKa = 4.13TKK100 pKa = 10.55LIEE103 pKa = 3.92EE104 pKa = 4.68LEE106 pKa = 4.2RR107 pKa = 11.84FRR109 pKa = 11.84RR110 pKa = 11.84WYY112 pKa = 10.81SIDD115 pKa = 3.35SEE117 pKa = 4.88AYY119 pKa = 7.32CTNLGTMQEE128 pKa = 4.14TRR130 pKa = 11.84MPLRR134 pKa = 11.84DD135 pKa = 4.29AIVTSRR141 pKa = 11.84VEE143 pKa = 4.69GIDD146 pKa = 3.5GNTNKK151 pKa = 10.19YY152 pKa = 10.08EE153 pKa = 4.1YY154 pKa = 10.88DD155 pKa = 3.28FSEE158 pKa = 4.4CMNYY162 pKa = 10.07PLDD165 pKa = 4.02EE166 pKa = 4.89YY167 pKa = 10.65IVSLGDD173 pKa = 3.61MIAMGEE179 pKa = 4.13EE180 pKa = 4.22EE181 pKa = 4.9EE182 pKa = 4.25EE183 pKa = 4.69TEE185 pKa = 5.21NSTDD189 pKa = 3.75DD190 pKa = 3.4
MM1 pKa = 7.59NKK3 pKa = 9.78RR4 pKa = 11.84EE5 pKa = 4.41LYY7 pKa = 10.61ALLDD11 pKa = 3.52IEE13 pKa = 4.5SPEE16 pKa = 3.72EE17 pKa = 3.79FEE19 pKa = 4.67YY20 pKa = 11.19FEE22 pKa = 4.71NLADD26 pKa = 3.78YY27 pKa = 10.5LEE29 pKa = 5.01CEE31 pKa = 4.3EE32 pKa = 4.52EE33 pKa = 4.49LDD35 pKa = 3.93YY36 pKa = 11.7TDD38 pKa = 4.09VAEE41 pKa = 5.3LFNGVNKK48 pKa = 10.48DD49 pKa = 3.7VLAQLCDD56 pKa = 3.35NYY58 pKa = 10.76FEE60 pKa = 5.16EE61 pKa = 5.12ISGFVPGSQTEE72 pKa = 4.17VFTIFEE78 pKa = 4.54NIRR81 pKa = 11.84RR82 pKa = 11.84ALVGMCRR89 pKa = 11.84NCSDD93 pKa = 5.19DD94 pKa = 4.35EE95 pKa = 4.17NLEE98 pKa = 4.13TKK100 pKa = 10.55LIEE103 pKa = 3.92EE104 pKa = 4.68LEE106 pKa = 4.2RR107 pKa = 11.84FRR109 pKa = 11.84RR110 pKa = 11.84WYY112 pKa = 10.81SIDD115 pKa = 3.35SEE117 pKa = 4.88AYY119 pKa = 7.32CTNLGTMQEE128 pKa = 4.14TRR130 pKa = 11.84MPLRR134 pKa = 11.84DD135 pKa = 4.29AIVTSRR141 pKa = 11.84VEE143 pKa = 4.69GIDD146 pKa = 3.5GNTNKK151 pKa = 10.19YY152 pKa = 10.08EE153 pKa = 4.1YY154 pKa = 10.88DD155 pKa = 3.28FSEE158 pKa = 4.4CMNYY162 pKa = 10.07PLDD165 pKa = 4.02EE166 pKa = 4.89YY167 pKa = 10.65IVSLGDD173 pKa = 3.61MIAMGEE179 pKa = 4.13EE180 pKa = 4.22EE181 pKa = 4.9EE182 pKa = 4.25EE183 pKa = 4.69TEE185 pKa = 5.21NSTDD189 pKa = 3.75DD190 pKa = 3.4
Molecular weight: 22.18 kDa
Isoelectric point according different methods:
Protein with the highest isoelectric point:
>tr|R6E2I4|R6E2I4_9FIRM Pyridine nucleotide-disulphide oxidoreductase family protein OS=Firmicutes bacterium CAG:238 OX=1263011 GN=BN553_00231 PE=4 SV=1
MM1 pKa = 8.02DD2 pKa = 4.37HH3 pKa = 6.54RR4 pKa = 11.84TRR6 pKa = 11.84MNRR9 pKa = 11.84IRR11 pKa = 11.84SLTAVYY17 pKa = 10.27RR18 pKa = 11.84SRR20 pKa = 11.84HH21 pKa = 4.77EE22 pKa = 3.94NRR24 pKa = 11.84VIAALSCMCAVLLGGLGLILSGKK47 pKa = 8.3MSPGLFMVQQNYY59 pKa = 9.45GAVLLRR65 pKa = 11.84GSQKK69 pKa = 10.29PYY71 pKa = 10.75FVIALLAFLAGVTFTLICIKK91 pKa = 10.29INQKK95 pKa = 7.18TRR97 pKa = 11.84RR98 pKa = 11.84LRR100 pKa = 11.84EE101 pKa = 4.02EE102 pKa = 3.7EE103 pKa = 4.04TKK105 pKa = 10.66EE106 pKa = 4.38CEE108 pKa = 4.01RR109 pKa = 11.84QNASNRR115 pKa = 11.84ATQQ118 pKa = 3.05
MM1 pKa = 8.02DD2 pKa = 4.37HH3 pKa = 6.54RR4 pKa = 11.84TRR6 pKa = 11.84MNRR9 pKa = 11.84IRR11 pKa = 11.84SLTAVYY17 pKa = 10.27RR18 pKa = 11.84SRR20 pKa = 11.84HH21 pKa = 4.77EE22 pKa = 3.94NRR24 pKa = 11.84VIAALSCMCAVLLGGLGLILSGKK47 pKa = 8.3MSPGLFMVQQNYY59 pKa = 9.45GAVLLRR65 pKa = 11.84GSQKK69 pKa = 10.29PYY71 pKa = 10.75FVIALLAFLAGVTFTLICIKK91 pKa = 10.29INQKK95 pKa = 7.18TRR97 pKa = 11.84RR98 pKa = 11.84LRR100 pKa = 11.84EE101 pKa = 4.02EE102 pKa = 3.7EE103 pKa = 4.04TKK105 pKa = 10.66EE106 pKa = 4.38CEE108 pKa = 4.01RR109 pKa = 11.84QNASNRR115 pKa = 11.84ATQQ118 pKa = 3.05
Molecular weight: 13.32 kDa
Isoelectric point according different methods:
Peptides (in silico digests for buttom-up proteomics)
Below you can find in silico digests of the whole proteome with Trypsin, Chymotrypsin, Trypsin+LysC, LysN, ArgC proteases suitable for different mass spec machines.| Try ESI |
 |
|---|
| ChTry ESI |
 |
|---|
| ArgC ESI |
 |
|---|
| LysN ESI |
 |
|---|
| TryLysC ESI |
 |
|---|
| Try MALDI |
 |
|---|
| ChTry MALDI |
 |
|---|
| ArgC MALDI |
 |
|---|
| LysN MALDI |
 |
|---|
| TryLysC MALDI |
 |
|---|
| Try LTQ |
 |
|---|
| ChTry LTQ |
 |
|---|
| ArgC LTQ |
 |
|---|
| LysN LTQ |
 |
|---|
| TryLysC LTQ |
 |
|---|
| Try MSlow |
 |
|---|
| ChTry MSlow |
 |
|---|
| ArgC MSlow |
 |
|---|
| LysN MSlow |
 |
|---|
| TryLysC MSlow |
 |
|---|
| Try MShigh |
 |
|---|
| ChTry MShigh |
 |
|---|
| ArgC MShigh |
 |
|---|
| LysN MShigh |
 |
|---|
| TryLysC MShigh |
 |
|---|
General Statistics
Number of major isoforms |
Number of additional isoforms |
Number of all proteins |
Number of amino acids |
Min. Seq. Length |
Max. Seq. Length |
Avg. Seq. Length |
Avg. Mol. Weight |
|---|---|---|---|---|---|---|---|
0 |
603940 |
30 |
2015 |
299.6 |
33.4 |
Amino acid frequency
Ala |
Cys |
Asp |
Glu |
Phe |
Gly |
His |
Ile |
Lys |
Leu |
|---|---|---|---|---|---|---|---|---|---|
8.289 ± 0.062 | 1.549 ± 0.025 |
5.635 ± 0.041 | 7.711 ± 0.061 |
4.135 ± 0.039 | 7.369 ± 0.047 |
1.59 ± 0.024 | 7.587 ± 0.051 |
7.22 ± 0.053 | 8.708 ± 0.058 |
Met |
Asn |
Gln |
Pro |
Arg |
Ser |
Thr |
Val |
Trp |
Tyr |
|---|---|---|---|---|---|---|---|---|---|
3.056 ± 0.031 | 4.224 ± 0.036 |
3.331 ± 0.03 | 2.766 ± 0.03 |
4.407 ± 0.051 | 5.618 ± 0.046 |
5.428 ± 0.048 | 6.665 ± 0.043 |
0.814 ± 0.016 | 3.895 ± 0.041 |
Most of the basic statistics you can see at this page can be downloaded from this CSV file
Proteome-pI is available under Creative Commons Attribution-NoDerivs license, for more details see here
| Reference: Kozlowski LP. Proteome-pI 2.0: Proteome Isoelectric Point Database Update. Nucleic Acids Res. 2021, doi: 10.1093/nar/gkab944 | Contact: Lukasz P. Kozlowski |
