Artemisia virus A
Taxonomy: Viruses; Riboviria; Orthornavirae; Pisuviricota; Pisoniviricetes; Sobelivirales; Solemoviridae; Sobemovirus
Average proteome isoelectric point is 6.32
Get precalculated fractions of proteins

Virtual 2D-PAGE plot for 4 proteins (isoelectric point calculated using IPC2_protein)
Get csv file with sequences according to given criteria:
* You can choose from 21 different methods for calculating isoelectric point
Summary statistics related to proteome-wise predictions


Protein with the lowest isoelectric point:
>tr|I1WZY7|I1WZY7_9VIRU N-terminal protein OS=Artemisia virus A OX=1133751 PE=4 SV=1
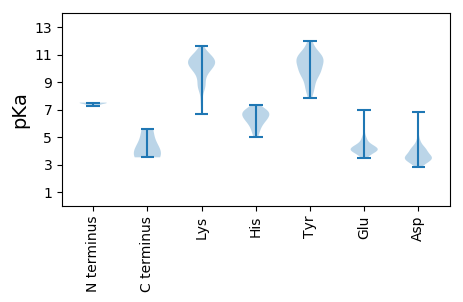
MM1 pKa = 7.44SSVIFAFGVSKK12 pKa = 9.23TYY14 pKa = 8.43PTIVEE19 pKa = 4.68KK20 pKa = 11.46YY21 pKa = 8.64CGSSKK26 pKa = 10.7KK27 pKa = 10.36VFFRR31 pKa = 11.84GLAPGIEE38 pKa = 4.32TSLTVDD44 pKa = 3.23SPIKK48 pKa = 10.74VKK50 pKa = 9.61VAKK53 pKa = 9.59WNRR56 pKa = 11.84DD57 pKa = 3.3SVDD60 pKa = 3.55EE61 pKa = 5.22LEE63 pKa = 4.47ITCKK67 pKa = 10.8CEE69 pKa = 3.7TCGAKK74 pKa = 10.28AFEE77 pKa = 4.13ILEE80 pKa = 4.18FKK82 pKa = 10.91YY83 pKa = 10.89ADD85 pKa = 3.64NGDD88 pKa = 4.65EE89 pKa = 3.85IWEE92 pKa = 4.44TEE94 pKa = 4.83VVADD98 pKa = 3.46WCSYY102 pKa = 11.43CEE104 pKa = 4.09TKK106 pKa = 10.72KK107 pKa = 10.95LFDD110 pKa = 4.2SGDD113 pKa = 3.72TEE115 pKa = 5.58HH116 pKa = 6.38YY117 pKa = 8.03TPCPSPPAPISNN129 pKa = 3.66
MM1 pKa = 7.44SSVIFAFGVSKK12 pKa = 9.23TYY14 pKa = 8.43PTIVEE19 pKa = 4.68KK20 pKa = 11.46YY21 pKa = 8.64CGSSKK26 pKa = 10.7KK27 pKa = 10.36VFFRR31 pKa = 11.84GLAPGIEE38 pKa = 4.32TSLTVDD44 pKa = 3.23SPIKK48 pKa = 10.74VKK50 pKa = 9.61VAKK53 pKa = 9.59WNRR56 pKa = 11.84DD57 pKa = 3.3SVDD60 pKa = 3.55EE61 pKa = 5.22LEE63 pKa = 4.47ITCKK67 pKa = 10.8CEE69 pKa = 3.7TCGAKK74 pKa = 10.28AFEE77 pKa = 4.13ILEE80 pKa = 4.18FKK82 pKa = 10.91YY83 pKa = 10.89ADD85 pKa = 3.64NGDD88 pKa = 4.65EE89 pKa = 3.85IWEE92 pKa = 4.44TEE94 pKa = 4.83VVADD98 pKa = 3.46WCSYY102 pKa = 11.43CEE104 pKa = 4.09TKK106 pKa = 10.72KK107 pKa = 10.95LFDD110 pKa = 4.2SGDD113 pKa = 3.72TEE115 pKa = 5.58HH116 pKa = 6.38YY117 pKa = 8.03TPCPSPPAPISNN129 pKa = 3.66
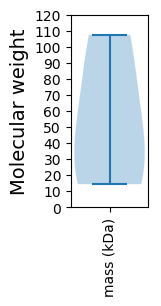
Molecular weight: 14.34 kDa
Isoelectric point according different methods:
Protein with the highest isoelectric point:
>tr|I1WZY8|I1WZY8_9VIRU Capsid protein OS=Artemisia virus A OX=1133751 PE=3 SV=1
MM1 pKa = 7.29TKK3 pKa = 10.35KK4 pKa = 10.51KK5 pKa = 7.71QTXSNNGNGQRR16 pKa = 11.84RR17 pKa = 11.84RR18 pKa = 11.84RR19 pKa = 11.84RR20 pKa = 11.84TRR22 pKa = 11.84PIPLPSGAEE31 pKa = 3.77LGSVVRR37 pKa = 11.84APSAMSHH44 pKa = 5.28NVRR47 pKa = 11.84KK48 pKa = 9.81RR49 pKa = 11.84NQIIRR54 pKa = 11.84QSTLGEE60 pKa = 3.98MCIGTEE66 pKa = 4.11STPLLATHH74 pKa = 6.79ATANTEE80 pKa = 3.9VIGFVNIDD88 pKa = 3.5VRR90 pKa = 11.84NSTQLNRR97 pKa = 11.84LSIIGSAFSKK107 pKa = 10.57FRR109 pKa = 11.84VLKK112 pKa = 7.96MTAVYY117 pKa = 10.42SPEE120 pKa = 3.51IATNISGAIAMALIYY135 pKa = 10.79DD136 pKa = 4.03SADD139 pKa = 2.98VVAANWNIQRR149 pKa = 11.84ILATDD154 pKa = 3.59KK155 pKa = 11.03AVKK158 pKa = 10.31SNLWTMSPPIRR169 pKa = 11.84YY170 pKa = 9.55DD171 pKa = 2.98NRR173 pKa = 11.84LAAKK177 pKa = 8.84PWYY180 pKa = 9.72ISGTTAGVGAQNEE193 pKa = 4.29QTPVTIVYY201 pKa = 9.71GYY203 pKa = 10.32YY204 pKa = 10.58SNSTNIPTGRR214 pKa = 11.84IDD216 pKa = 3.06VHH218 pKa = 7.34YY219 pKa = 9.74EE220 pKa = 3.79VEE222 pKa = 4.45LVQPIAPLANTT233 pKa = 4.21
MM1 pKa = 7.29TKK3 pKa = 10.35KK4 pKa = 10.51KK5 pKa = 7.71QTXSNNGNGQRR16 pKa = 11.84RR17 pKa = 11.84RR18 pKa = 11.84RR19 pKa = 11.84RR20 pKa = 11.84TRR22 pKa = 11.84PIPLPSGAEE31 pKa = 3.77LGSVVRR37 pKa = 11.84APSAMSHH44 pKa = 5.28NVRR47 pKa = 11.84KK48 pKa = 9.81RR49 pKa = 11.84NQIIRR54 pKa = 11.84QSTLGEE60 pKa = 3.98MCIGTEE66 pKa = 4.11STPLLATHH74 pKa = 6.79ATANTEE80 pKa = 3.9VIGFVNIDD88 pKa = 3.5VRR90 pKa = 11.84NSTQLNRR97 pKa = 11.84LSIIGSAFSKK107 pKa = 10.57FRR109 pKa = 11.84VLKK112 pKa = 7.96MTAVYY117 pKa = 10.42SPEE120 pKa = 3.51IATNISGAIAMALIYY135 pKa = 10.79DD136 pKa = 4.03SADD139 pKa = 2.98VVAANWNIQRR149 pKa = 11.84ILATDD154 pKa = 3.59KK155 pKa = 11.03AVKK158 pKa = 10.31SNLWTMSPPIRR169 pKa = 11.84YY170 pKa = 9.55DD171 pKa = 2.98NRR173 pKa = 11.84LAAKK177 pKa = 8.84PWYY180 pKa = 9.72ISGTTAGVGAQNEE193 pKa = 4.29QTPVTIVYY201 pKa = 9.71GYY203 pKa = 10.32YY204 pKa = 10.58SNSTNIPTGRR214 pKa = 11.84IDD216 pKa = 3.06VHH218 pKa = 7.34YY219 pKa = 9.74EE220 pKa = 3.79VEE222 pKa = 4.45LVQPIAPLANTT233 pKa = 4.21
Molecular weight: 25.37 kDa
Isoelectric point according different methods:
Peptides (in silico digests for buttom-up proteomics)
Below you can find in silico digests of the whole proteome with Trypsin, Chymotrypsin, Trypsin+LysC, LysN, ArgC proteases suitable for different mass spec machines.| Try ESI |
 |
|---|
| ChTry ESI |
 |
|---|
| ArgC ESI |
 |
|---|
| LysN ESI |
 |
|---|
| TryLysC ESI |
 |
|---|
| Try MALDI |
 |
|---|
| ChTry MALDI |
 |
|---|
| ArgC MALDI |
 |
|---|
| LysN MALDI |
 |
|---|
| TryLysC MALDI |
 |
|---|
| Try LTQ |
 |
|---|
| ChTry LTQ |
 |
|---|
| ArgC LTQ |
 |
|---|
| LysN LTQ |
 |
|---|
| TryLysC LTQ |
 |
|---|
| Try MSlow |
 |
|---|
| ChTry MSlow |
 |
|---|
| ArgC MSlow |
 |
|---|
| LysN MSlow |
 |
|---|
| TryLysC MSlow |
 |
|---|
| Try MShigh |
 |
|---|
| ChTry MShigh |
 |
|---|
| ArgC MShigh |
 |
|---|
| LysN MShigh |
 |
|---|
| TryLysC MShigh |
 |
|---|
General Statistics
Number of major isoforms |
Number of additional isoforms |
Number of all proteins |
Number of amino acids |
Min. Seq. Length |
Max. Seq. Length |
Avg. Seq. Length |
Avg. Mol. Weight |
|---|---|---|---|---|---|---|---|
0 |
1902 |
129 |
956 |
475.5 |
52.94 |
Amino acid frequency
Ala |
Cys |
Asp |
Glu |
Phe |
Gly |
His |
Ile |
Lys |
Leu |
|---|---|---|---|---|---|---|---|---|---|
7.203 ± 0.686 | 1.577 ± 0.496 |
5.047 ± 0.542 | 7.203 ± 0.784 |
4.574 ± 0.732 | 6.782 ± 0.31 |
1.209 ± 0.106 | 5.047 ± 0.938 |
6.204 ± 0.543 | 7.729 ± 0.791 |
Met |
Asn |
Gln |
Pro |
Arg |
Ser |
Thr |
Val |
Trp |
Tyr |
|---|---|---|---|---|---|---|---|---|---|
1.945 ± 0.163 | 3.523 ± 0.928 |
5.731 ± 0.647 | 3.628 ± 0.48 |
5.573 ± 0.6 | 9.727 ± 0.685 |
5.363 ± 1.06 | 6.887 ± 0.218 |
2.156 ± 0.214 | 2.787 ± 0.343 |
Most of the basic statistics you can see at this page can be downloaded from this CSV file
Proteome-pI is available under Creative Commons Attribution-NoDerivs license, for more details see here
| Reference: Kozlowski LP. Proteome-pI 2.0: Proteome Isoelectric Point Database Update. Nucleic Acids Res. 2021, doi: 10.1093/nar/gkab944 | Contact: Lukasz P. Kozlowski |
