Bhendi yellow vein India betasatellite [India:Aurangabad:OY164:2006]
Taxonomy: Viruses; Tolecusatellitidae; Betasatellite; unclassified Betasatellite; Bhendi yellow vein India betasatellite
Average proteome isoelectric point is 6.35
Get precalculated fractions of proteins
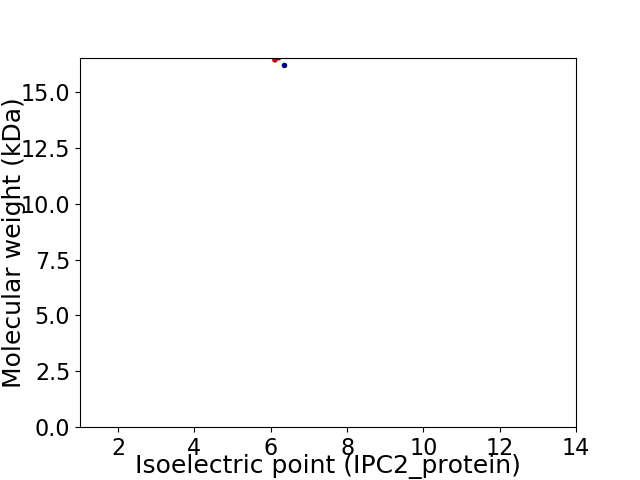
Virtual 2D-PAGE plot for 1 proteins (isoelectric point calculated using IPC2_protein)
Get csv file with sequences according to given criteria:
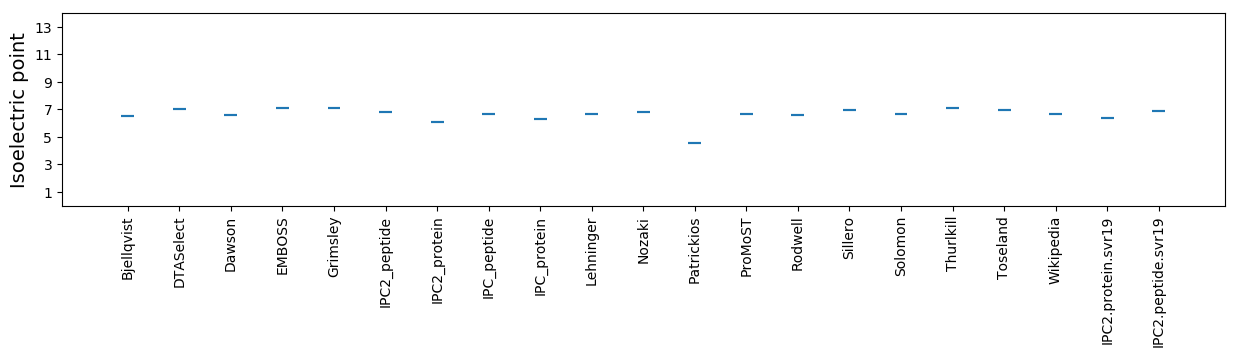
* You can choose from 21 different methods for calculating isoelectric point
Summary statistics related to proteome-wise predictions
Protein with the lowest isoelectric point:
>tr|E7BND2|E7BND2_9VIRU C1 protein OS=Bhendi yellow vein India betasatellite [India:Aurangabad:OY164:2006] OX=908010 GN=C1 PE=4 SV=1
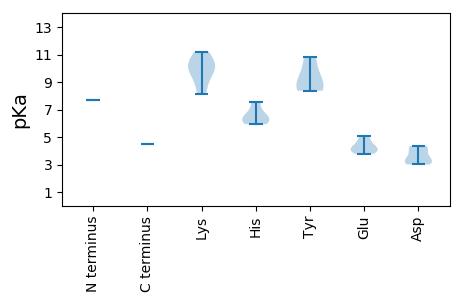
MM1 pKa = 7.67KK2 pKa = 10.12ISNHH6 pKa = 6.52FIHH9 pKa = 7.53IFISSIYY16 pKa = 9.26IRR18 pKa = 11.84RR19 pKa = 11.84TIKK22 pKa = 8.1MTRR25 pKa = 11.84FSKK28 pKa = 10.35NRR30 pKa = 11.84EE31 pKa = 4.0GIVFKK36 pKa = 11.21VDD38 pKa = 3.01VRR40 pKa = 11.84LMQQQRR46 pKa = 11.84ISVQMQISSTRR57 pKa = 11.84SPAISTKK64 pKa = 8.93TFIIDD69 pKa = 3.13YY70 pKa = 8.37TYY72 pKa = 10.85QQLHH76 pKa = 6.45IPFDD80 pKa = 4.34FNGLEE85 pKa = 4.12GTITSTFKK93 pKa = 9.83FHH95 pKa = 6.13YY96 pKa = 8.58WGSKK100 pKa = 9.77AEE102 pKa = 4.51EE103 pKa = 4.2ILEE106 pKa = 3.83EE107 pKa = 5.07DD108 pKa = 4.3IIHH111 pKa = 5.94MVDD114 pKa = 3.9IIIIEE119 pKa = 4.27NPEE122 pKa = 3.78IMGMDD127 pKa = 3.32VNEE130 pKa = 4.77PVTIDD135 pKa = 3.29NKK137 pKa = 10.73IIII140 pKa = 4.47
MM1 pKa = 7.67KK2 pKa = 10.12ISNHH6 pKa = 6.52FIHH9 pKa = 7.53IFISSIYY16 pKa = 9.26IRR18 pKa = 11.84RR19 pKa = 11.84TIKK22 pKa = 8.1MTRR25 pKa = 11.84FSKK28 pKa = 10.35NRR30 pKa = 11.84EE31 pKa = 4.0GIVFKK36 pKa = 11.21VDD38 pKa = 3.01VRR40 pKa = 11.84LMQQQRR46 pKa = 11.84ISVQMQISSTRR57 pKa = 11.84SPAISTKK64 pKa = 8.93TFIIDD69 pKa = 3.13YY70 pKa = 8.37TYY72 pKa = 10.85QQLHH76 pKa = 6.45IPFDD80 pKa = 4.34FNGLEE85 pKa = 4.12GTITSTFKK93 pKa = 9.83FHH95 pKa = 6.13YY96 pKa = 8.58WGSKK100 pKa = 9.77AEE102 pKa = 4.51EE103 pKa = 4.2ILEE106 pKa = 3.83EE107 pKa = 5.07DD108 pKa = 4.3IIHH111 pKa = 5.94MVDD114 pKa = 3.9IIIIEE119 pKa = 4.27NPEE122 pKa = 3.78IMGMDD127 pKa = 3.32VNEE130 pKa = 4.77PVTIDD135 pKa = 3.29NKK137 pKa = 10.73IIII140 pKa = 4.47
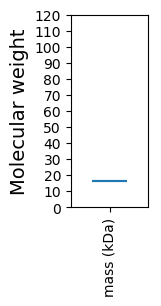
Molecular weight: 16.44 kDa
Isoelectric point according different methods:
Protein with the highest isoelectric point:
>tr|E7BND2|E7BND2_9VIRU C1 protein OS=Bhendi yellow vein India betasatellite [India:Aurangabad:OY164:2006] OX=908010 GN=C1 PE=4 SV=1
MM1 pKa = 7.67KK2 pKa = 10.12ISNHH6 pKa = 6.52FIHH9 pKa = 7.53IFISSIYY16 pKa = 9.26IRR18 pKa = 11.84RR19 pKa = 11.84TIKK22 pKa = 8.1MTRR25 pKa = 11.84FSKK28 pKa = 10.35NRR30 pKa = 11.84EE31 pKa = 4.0GIVFKK36 pKa = 11.21VDD38 pKa = 3.01VRR40 pKa = 11.84LMQQQRR46 pKa = 11.84ISVQMQISSTRR57 pKa = 11.84SPAISTKK64 pKa = 8.93TFIIDD69 pKa = 3.13YY70 pKa = 8.37TYY72 pKa = 10.85QQLHH76 pKa = 6.45IPFDD80 pKa = 4.34FNGLEE85 pKa = 4.12GTITSTFKK93 pKa = 9.83FHH95 pKa = 6.13YY96 pKa = 8.58WGSKK100 pKa = 9.77AEE102 pKa = 4.51EE103 pKa = 4.2ILEE106 pKa = 3.83EE107 pKa = 5.07DD108 pKa = 4.3IIHH111 pKa = 5.94MVDD114 pKa = 3.9IIIIEE119 pKa = 4.27NPEE122 pKa = 3.78IMGMDD127 pKa = 3.32VNEE130 pKa = 4.77PVTIDD135 pKa = 3.29NKK137 pKa = 10.73IIII140 pKa = 4.47
MM1 pKa = 7.67KK2 pKa = 10.12ISNHH6 pKa = 6.52FIHH9 pKa = 7.53IFISSIYY16 pKa = 9.26IRR18 pKa = 11.84RR19 pKa = 11.84TIKK22 pKa = 8.1MTRR25 pKa = 11.84FSKK28 pKa = 10.35NRR30 pKa = 11.84EE31 pKa = 4.0GIVFKK36 pKa = 11.21VDD38 pKa = 3.01VRR40 pKa = 11.84LMQQQRR46 pKa = 11.84ISVQMQISSTRR57 pKa = 11.84SPAISTKK64 pKa = 8.93TFIIDD69 pKa = 3.13YY70 pKa = 8.37TYY72 pKa = 10.85QQLHH76 pKa = 6.45IPFDD80 pKa = 4.34FNGLEE85 pKa = 4.12GTITSTFKK93 pKa = 9.83FHH95 pKa = 6.13YY96 pKa = 8.58WGSKK100 pKa = 9.77AEE102 pKa = 4.51EE103 pKa = 4.2ILEE106 pKa = 3.83EE107 pKa = 5.07DD108 pKa = 4.3IIHH111 pKa = 5.94MVDD114 pKa = 3.9IIIIEE119 pKa = 4.27NPEE122 pKa = 3.78IMGMDD127 pKa = 3.32VNEE130 pKa = 4.77PVTIDD135 pKa = 3.29NKK137 pKa = 10.73IIII140 pKa = 4.47
Molecular weight: 16.44 kDa
Isoelectric point according different methods:
Peptides (in silico digests for buttom-up proteomics)
Below you can find in silico digests of the whole proteome with Trypsin, Chymotrypsin, Trypsin+LysC, LysN, ArgC proteases suitable for different mass spec machines.| Try ESI |
 |
|---|
| ChTry ESI |
|
|---|
| ArgC ESI |
|
|---|
| LysN ESI |
|
|---|
| TryLysC ESI |
|
|---|
| Try MALDI |
|
|---|
| ChTry MALDI |
|
|---|
| ArgC MALDI |
|
|---|
| LysN MALDI |
|
|---|
| TryLysC MALDI |
|
|---|
| Try LTQ |
|
|---|
| ChTry LTQ |
|
|---|
| ArgC LTQ |
|
|---|
| LysN LTQ |
|
|---|
| TryLysC LTQ |
|
|---|
| Try MSlow |
|
|---|
| ChTry MSlow |
|
|---|
| ArgC MSlow |
|
|---|
| LysN MSlow |
|
|---|
| TryLysC MSlow |
|
|---|
| Try MShigh |
|
|---|
| ChTry MShigh |
|
|---|
| ArgC MShigh |
|
|---|
| LysN MShigh |
|
|---|
| TryLysC MShigh |
|
|---|
General Statistics
Number of major isoforms |
Number of additional isoforms |
Number of all proteins |
Number of amino acids |
Min. Seq. Length |
Max. Seq. Length |
Avg. Seq. Length |
Avg. Mol. Weight |
|---|---|---|---|---|---|---|---|
0 |
140 |
140 |
140 |
140.0 |
16.44 |
Amino acid frequency
Ala |
Cys |
Asp |
Glu |
Phe |
Gly |
His |
Ile |
Lys |
Leu |
|---|---|---|---|---|---|---|---|---|---|
1.429 ± 0.0 | 0.0 ± 0.0 |
5.0 ± 0.0 | 6.429 ± 0.0 |
6.429 ± 0.0 | 3.571 ± 0.0 |
3.571 ± 0.0 | 19.286 ± 0.0 |
5.714 ± 0.0 | 2.857 ± 0.0 |
Met |
Asn |
Gln |
Pro |
Arg |
Ser |
Thr |
Val |
Trp |
Tyr |
|---|---|---|---|---|---|---|---|---|---|
5.0 ± 0.0 | 4.286 ± 0.0 |
2.857 ± 0.0 | 5.0 ± 0.0 |
5.0 ± 0.0 | 7.857 ± 0.0 |
7.143 ± 0.0 | 5.0 ± 0.0 |
0.714 ± 0.0 | 2.857 ± 0.0 |
Most of the basic statistics you can see at this page can be downloaded from this CSV file
See this proteome in:

Proteome-pI is available under Creative Commons Attribution-NoDerivs license, for more details see here
| Reference: Kozlowski LP. Proteome-pI 2.0: Proteome Isoelectric Point Database Update. Nucleic Acids Res. 2021, doi: 10.1093/nar/gkab944 | Contact: Lukasz P. Kozlowski |