Leucobacter triazinivorans
Taxonomy: cellular organisms; Bacteria; Terrabacteria group; Actinobacteria; Actinomycetia; Micrococcales; Microbacteriaceae; Leucobacter
Average proteome isoelectric point is 6.08
Get precalculated fractions of proteins

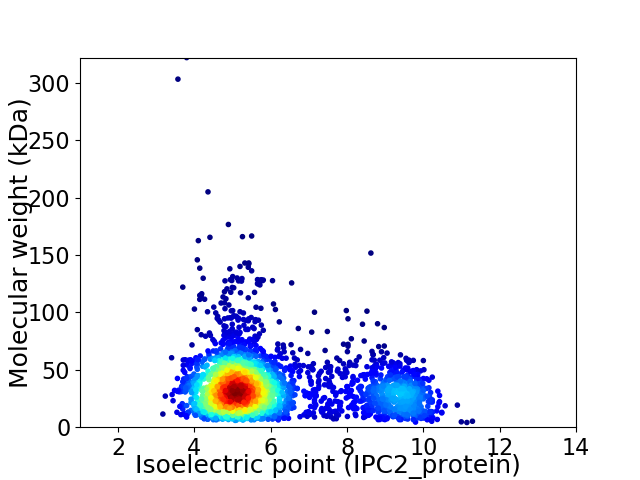
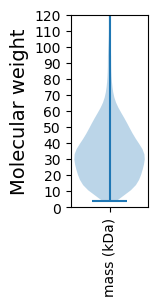
Virtual 2D-PAGE plot for 2978 proteins (isoelectric point calculated using IPC2_protein)
Get csv file with sequences according to given criteria:
* You can choose from 21 different methods for calculating isoelectric point
Summary statistics related to proteome-wise predictions


Protein with the lowest isoelectric point:
>tr|A0A4P6KH53|A0A4P6KH53_9MICO Glycosyltransferase OS=Leucobacter triazinivorans OX=1784719 GN=EVS81_11660 PE=4 SV=1
MM1 pKa = 7.82KK2 pKa = 10.54SRR4 pKa = 11.84ILGAAALTAAAALVLSGCAGGEE26 pKa = 4.17SGEE29 pKa = 4.22GAPIKK34 pKa = 10.4LGSVNTISGPATFPEE49 pKa = 4.41ASEE52 pKa = 3.93AAQAVFDD59 pKa = 4.28QVNADD64 pKa = 3.34GGINGRR70 pKa = 11.84MIEE73 pKa = 4.22YY74 pKa = 10.42KK75 pKa = 9.44ITDD78 pKa = 4.06DD79 pKa = 4.31KK80 pKa = 11.76ADD82 pKa = 4.12PATATASARR91 pKa = 11.84EE92 pKa = 4.1LVGSDD97 pKa = 3.18EE98 pKa = 4.39VVALVGSASLLDD110 pKa = 3.9CEE112 pKa = 5.39INAKK116 pKa = 10.38YY117 pKa = 10.35YY118 pKa = 8.14EE119 pKa = 4.16QEE121 pKa = 4.1GVRR124 pKa = 11.84SIQGIGVDD132 pKa = 4.16PGCFSSPNIAPANIGPFNDD151 pKa = 3.42TTLTMLYY158 pKa = 10.36GSEE161 pKa = 4.01EE162 pKa = 4.14LGLEE166 pKa = 4.08NLCVLTSVIGSTGPAYY182 pKa = 9.98QAAVDD187 pKa = 3.71RR188 pKa = 11.84WTEE191 pKa = 3.75ITGKK195 pKa = 10.34EE196 pKa = 3.96PTFVDD201 pKa = 3.28DD202 pKa = 3.62TVPYY206 pKa = 10.46GGADD210 pKa = 3.35YY211 pKa = 10.38TPYY214 pKa = 10.05IVKK217 pKa = 10.19ARR219 pKa = 11.84EE220 pKa = 4.0AGCDD224 pKa = 3.66GIVANSVEE232 pKa = 4.14PDD234 pKa = 3.56AIGLIKK240 pKa = 10.4AANQQGWDD248 pKa = 3.64DD249 pKa = 3.75VTFLLLTSVYY259 pKa = 10.34SEE261 pKa = 4.34SFAAAVDD268 pKa = 3.68NSAAGVYY275 pKa = 9.86VPAEE279 pKa = 4.23FYY281 pKa = 10.66PFTEE285 pKa = 4.92DD286 pKa = 4.06SDD288 pKa = 5.06VNADD292 pKa = 2.96WKK294 pKa = 11.46ALMEE298 pKa = 4.75EE299 pKa = 4.05NDD301 pKa = 3.14ITLTSFSQGGYY312 pKa = 9.52LAATFLVEE320 pKa = 4.01VLEE323 pKa = 4.64SIEE326 pKa = 4.12GDD328 pKa = 3.06ITRR331 pKa = 11.84DD332 pKa = 3.35SVNQALSDD340 pKa = 3.77MDD342 pKa = 5.33PIANPMIAYY351 pKa = 8.0EE352 pKa = 4.02YY353 pKa = 10.62QFDD356 pKa = 4.34RR357 pKa = 11.84IAAQDD362 pKa = 3.95YY363 pKa = 10.7QPGGWPVTLQSGTNAWEE380 pKa = 3.84QAADD384 pKa = 3.79DD385 pKa = 4.09WLMIPASS392 pKa = 3.61
MM1 pKa = 7.82KK2 pKa = 10.54SRR4 pKa = 11.84ILGAAALTAAAALVLSGCAGGEE26 pKa = 4.17SGEE29 pKa = 4.22GAPIKK34 pKa = 10.4LGSVNTISGPATFPEE49 pKa = 4.41ASEE52 pKa = 3.93AAQAVFDD59 pKa = 4.28QVNADD64 pKa = 3.34GGINGRR70 pKa = 11.84MIEE73 pKa = 4.22YY74 pKa = 10.42KK75 pKa = 9.44ITDD78 pKa = 4.06DD79 pKa = 4.31KK80 pKa = 11.76ADD82 pKa = 4.12PATATASARR91 pKa = 11.84EE92 pKa = 4.1LVGSDD97 pKa = 3.18EE98 pKa = 4.39VVALVGSASLLDD110 pKa = 3.9CEE112 pKa = 5.39INAKK116 pKa = 10.38YY117 pKa = 10.35YY118 pKa = 8.14EE119 pKa = 4.16QEE121 pKa = 4.1GVRR124 pKa = 11.84SIQGIGVDD132 pKa = 4.16PGCFSSPNIAPANIGPFNDD151 pKa = 3.42TTLTMLYY158 pKa = 10.36GSEE161 pKa = 4.01EE162 pKa = 4.14LGLEE166 pKa = 4.08NLCVLTSVIGSTGPAYY182 pKa = 9.98QAAVDD187 pKa = 3.71RR188 pKa = 11.84WTEE191 pKa = 3.75ITGKK195 pKa = 10.34EE196 pKa = 3.96PTFVDD201 pKa = 3.28DD202 pKa = 3.62TVPYY206 pKa = 10.46GGADD210 pKa = 3.35YY211 pKa = 10.38TPYY214 pKa = 10.05IVKK217 pKa = 10.19ARR219 pKa = 11.84EE220 pKa = 4.0AGCDD224 pKa = 3.66GIVANSVEE232 pKa = 4.14PDD234 pKa = 3.56AIGLIKK240 pKa = 10.4AANQQGWDD248 pKa = 3.64DD249 pKa = 3.75VTFLLLTSVYY259 pKa = 10.34SEE261 pKa = 4.34SFAAAVDD268 pKa = 3.68NSAAGVYY275 pKa = 9.86VPAEE279 pKa = 4.23FYY281 pKa = 10.66PFTEE285 pKa = 4.92DD286 pKa = 4.06SDD288 pKa = 5.06VNADD292 pKa = 2.96WKK294 pKa = 11.46ALMEE298 pKa = 4.75EE299 pKa = 4.05NDD301 pKa = 3.14ITLTSFSQGGYY312 pKa = 9.52LAATFLVEE320 pKa = 4.01VLEE323 pKa = 4.64SIEE326 pKa = 4.12GDD328 pKa = 3.06ITRR331 pKa = 11.84DD332 pKa = 3.35SVNQALSDD340 pKa = 3.77MDD342 pKa = 5.33PIANPMIAYY351 pKa = 8.0EE352 pKa = 4.02YY353 pKa = 10.62QFDD356 pKa = 4.34RR357 pKa = 11.84IAAQDD362 pKa = 3.95YY363 pKa = 10.7QPGGWPVTLQSGTNAWEE380 pKa = 3.84QAADD384 pKa = 3.79DD385 pKa = 4.09WLMIPASS392 pKa = 3.61
Molecular weight: 41.18 kDa
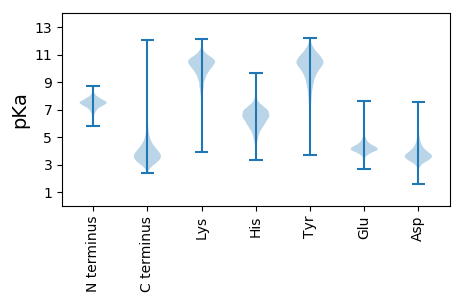
Isoelectric point according different methods:
Protein with the highest isoelectric point:
>tr|A0A4P6KEX9|A0A4P6KEX9_9MICO MFS transporter OS=Leucobacter triazinivorans OX=1784719 GN=EVS81_06365 PE=4 SV=1
MM1 pKa = 7.69SKK3 pKa = 9.0RR4 pKa = 11.84TFQPNNRR11 pKa = 11.84RR12 pKa = 11.84RR13 pKa = 11.84AKK15 pKa = 9.5VHH17 pKa = 5.46GFRR20 pKa = 11.84ARR22 pKa = 11.84MRR24 pKa = 11.84TRR26 pKa = 11.84AGRR29 pKa = 11.84AIVAARR35 pKa = 11.84RR36 pKa = 11.84GKK38 pKa = 10.45GRR40 pKa = 11.84SKK42 pKa = 10.13LTAA45 pKa = 4.04
MM1 pKa = 7.69SKK3 pKa = 9.0RR4 pKa = 11.84TFQPNNRR11 pKa = 11.84RR12 pKa = 11.84RR13 pKa = 11.84AKK15 pKa = 9.5VHH17 pKa = 5.46GFRR20 pKa = 11.84ARR22 pKa = 11.84MRR24 pKa = 11.84TRR26 pKa = 11.84AGRR29 pKa = 11.84AIVAARR35 pKa = 11.84RR36 pKa = 11.84GKK38 pKa = 10.45GRR40 pKa = 11.84SKK42 pKa = 10.13LTAA45 pKa = 4.04
Molecular weight: 5.18 kDa
Isoelectric point according different methods:
Peptides (in silico digests for buttom-up proteomics)
Below you can find in silico digests of the whole proteome with Trypsin, Chymotrypsin, Trypsin+LysC, LysN, ArgC proteases suitable for different mass spec machines.| Try ESI |
 |
|---|
| ChTry ESI |
 |
|---|
| ArgC ESI |
 |
|---|
| LysN ESI |
 |
|---|
| TryLysC ESI |
 |
|---|
| Try MALDI |
 |
|---|
| ChTry MALDI |
 |
|---|
| ArgC MALDI |
 |
|---|
| LysN MALDI |
 |
|---|
| TryLysC MALDI |
 |
|---|
| Try LTQ |
 |
|---|
| ChTry LTQ |
 |
|---|
| ArgC LTQ |
 |
|---|
| LysN LTQ |
 |
|---|
| TryLysC LTQ |
 |
|---|
| Try MSlow |
 |
|---|
| ChTry MSlow |
 |
|---|
| ArgC MSlow |
 |
|---|
| LysN MSlow |
 |
|---|
| TryLysC MSlow |
 |
|---|
| Try MShigh |
 |
|---|
| ChTry MShigh |
 |
|---|
| ArgC MShigh |
 |
|---|
| LysN MShigh |
 |
|---|
| TryLysC MShigh |
 |
|---|
General Statistics
Number of major isoforms |
Number of additional isoforms |
Number of all proteins |
Number of amino acids |
Min. Seq. Length |
Max. Seq. Length |
Avg. Seq. Length |
Avg. Mol. Weight |
|---|---|---|---|---|---|---|---|
0 |
1009833 |
32 |
3155 |
339.1 |
36.32 |
Amino acid frequency
Ala |
Cys |
Asp |
Glu |
Phe |
Gly |
His |
Ile |
Lys |
Leu |
|---|---|---|---|---|---|---|---|---|---|
13.669 ± 0.068 | 0.559 ± 0.01 |
5.855 ± 0.04 | 6.37 ± 0.048 |
3.09 ± 0.025 | 9.135 ± 0.05 |
2.023 ± 0.022 | 4.563 ± 0.035 |
1.79 ± 0.034 | 10.21 ± 0.057 |
Met |
Asn |
Gln |
Pro |
Arg |
Ser |
Thr |
Val |
Trp |
Tyr |
|---|---|---|---|---|---|---|---|---|---|
1.803 ± 0.022 | 1.855 ± 0.02 |
5.437 ± 0.034 | 2.928 ± 0.027 |
7.749 ± 0.058 | 5.656 ± 0.028 |
5.553 ± 0.041 | 8.446 ± 0.042 |
1.417 ± 0.02 | 1.891 ± 0.017 |
Most of the basic statistics you can see at this page can be downloaded from this CSV file
Proteome-pI is available under Creative Commons Attribution-NoDerivs license, for more details see here
| Reference: Kozlowski LP. Proteome-pI 2.0: Proteome Isoelectric Point Database Update. Nucleic Acids Res. 2021, doi: 10.1093/nar/gkab944 | Contact: Lukasz P. Kozlowski |
