SAR116 cluster alpha proteobacterium HIMB100
Taxonomy: cellular organisms; Bacteria; Proteobacteria; Alphaproteobacteria; Alphaproteobacteria incertae sedis; SAR116 cluster; unclassified SAR116 cluster
Average proteome isoelectric point is 6.08
Get precalculated fractions of proteins

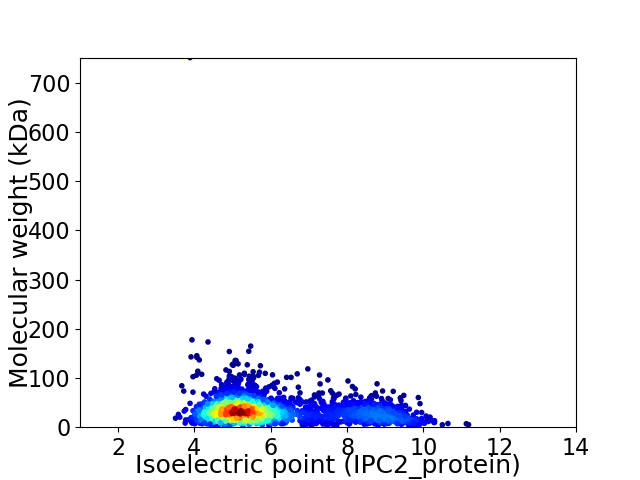
Virtual 2D-PAGE plot for 2334 proteins (isoelectric point calculated using IPC2_protein)
Get csv file with sequences according to given criteria:
* You can choose from 21 different methods for calculating isoelectric point
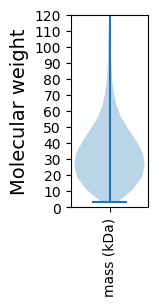
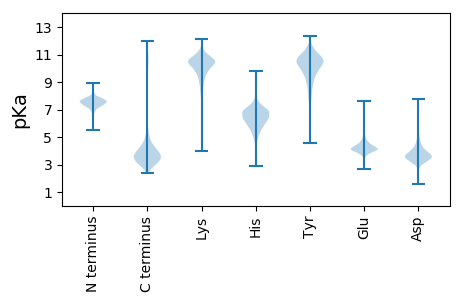
Summary statistics related to proteome-wise predictions


Protein with the lowest isoelectric point:
>tr|G5ZYX4|G5ZYX4_9PROT Putative permease OS=SAR116 cluster alpha proteobacterium HIMB100 OX=909943 GN=HIMB100_00011470 PE=3 SV=1
MM1 pKa = 7.36IRR3 pKa = 11.84FALTLLFLVASGLALAGTATSPSVTEE29 pKa = 3.99GNNAVVTFDD38 pKa = 4.42LGYY41 pKa = 7.53TAPSGGVEE49 pKa = 4.38VYY51 pKa = 10.42VSANSATATLGTDD64 pKa = 3.98FTVAASQLGYY74 pKa = 9.04RR75 pKa = 11.84TIAAGNQTLTVTAAIISDD93 pKa = 3.68GVTEE97 pKa = 4.22GNEE100 pKa = 3.92VFPVAFLEE108 pKa = 4.32NVSSNATFDD117 pKa = 3.42GGATEE122 pKa = 4.62WSDD125 pKa = 3.02KK126 pKa = 10.26TIRR129 pKa = 11.84TQPNVDD135 pKa = 4.25FTSSSPPIGNNVLHH149 pKa = 6.4IQNKK153 pKa = 7.17EE154 pKa = 3.57EE155 pKa = 4.48PYY157 pKa = 10.59RR158 pKa = 11.84SVSLNSGTDD167 pKa = 3.3YY168 pKa = 11.03DD169 pKa = 5.56IEE171 pKa = 4.6FDD173 pKa = 3.41WSEE176 pKa = 4.21ANADD180 pKa = 4.08GYY182 pKa = 11.67GSYY185 pKa = 10.99CDD187 pKa = 4.32DD188 pKa = 3.65SSVYY192 pKa = 10.83SGFVNAADD200 pKa = 3.85RR201 pKa = 11.84LVLQVIDD208 pKa = 4.37TVDD211 pKa = 3.0SSNNVSFTIDD221 pKa = 3.01NNMGNGAAQTSGDD234 pKa = 4.33SIFNFQGKK242 pKa = 9.51ISNLSWTGNSAAQVKK257 pKa = 8.7FVVYY261 pKa = 8.65DD262 pKa = 3.48TTNRR266 pKa = 11.84QYY268 pKa = 11.2EE269 pKa = 5.2GYY271 pKa = 9.56CGYY274 pKa = 10.99VIDD277 pKa = 4.63NFRR280 pKa = 11.84INKK283 pKa = 9.76SPVQTTVTISDD294 pKa = 4.59PDD296 pKa = 3.82TTPPTVSISSTTVTSGNTSNDD317 pKa = 2.8SSIALSFTLSEE328 pKa = 4.11TATDD332 pKa = 5.69FIASDD337 pKa = 3.37ISVTT341 pKa = 3.54
MM1 pKa = 7.36IRR3 pKa = 11.84FALTLLFLVASGLALAGTATSPSVTEE29 pKa = 3.99GNNAVVTFDD38 pKa = 4.42LGYY41 pKa = 7.53TAPSGGVEE49 pKa = 4.38VYY51 pKa = 10.42VSANSATATLGTDD64 pKa = 3.98FTVAASQLGYY74 pKa = 9.04RR75 pKa = 11.84TIAAGNQTLTVTAAIISDD93 pKa = 3.68GVTEE97 pKa = 4.22GNEE100 pKa = 3.92VFPVAFLEE108 pKa = 4.32NVSSNATFDD117 pKa = 3.42GGATEE122 pKa = 4.62WSDD125 pKa = 3.02KK126 pKa = 10.26TIRR129 pKa = 11.84TQPNVDD135 pKa = 4.25FTSSSPPIGNNVLHH149 pKa = 6.4IQNKK153 pKa = 7.17EE154 pKa = 3.57EE155 pKa = 4.48PYY157 pKa = 10.59RR158 pKa = 11.84SVSLNSGTDD167 pKa = 3.3YY168 pKa = 11.03DD169 pKa = 5.56IEE171 pKa = 4.6FDD173 pKa = 3.41WSEE176 pKa = 4.21ANADD180 pKa = 4.08GYY182 pKa = 11.67GSYY185 pKa = 10.99CDD187 pKa = 4.32DD188 pKa = 3.65SSVYY192 pKa = 10.83SGFVNAADD200 pKa = 3.85RR201 pKa = 11.84LVLQVIDD208 pKa = 4.37TVDD211 pKa = 3.0SSNNVSFTIDD221 pKa = 3.01NNMGNGAAQTSGDD234 pKa = 4.33SIFNFQGKK242 pKa = 9.51ISNLSWTGNSAAQVKK257 pKa = 8.7FVVYY261 pKa = 8.65DD262 pKa = 3.48TTNRR266 pKa = 11.84QYY268 pKa = 11.2EE269 pKa = 5.2GYY271 pKa = 9.56CGYY274 pKa = 10.99VIDD277 pKa = 4.63NFRR280 pKa = 11.84INKK283 pKa = 9.76SPVQTTVTISDD294 pKa = 4.59PDD296 pKa = 3.82TTPPTVSISSTTVTSGNTSNDD317 pKa = 2.8SSIALSFTLSEE328 pKa = 4.11TATDD332 pKa = 5.69FIASDD337 pKa = 3.37ISVTT341 pKa = 3.54
Molecular weight: 35.88 kDa
Isoelectric point according different methods:
Protein with the highest isoelectric point:
>tr|G5ZWN6|G5ZWN6_9PROT Major Facilitator Superfamily transporter OS=SAR116 cluster alpha proteobacterium HIMB100 OX=909943 GN=HIMB100_00004300 PE=4 SV=1
MM1 pKa = 7.48LKK3 pKa = 10.73ALILAILIMFVLLILLRR20 pKa = 11.84RR21 pKa = 11.84IPAIRR26 pKa = 11.84TWMNNLLRR34 pKa = 11.84QPLVRR39 pKa = 11.84SILFQGLWRR48 pKa = 11.84LIRR51 pKa = 11.84FLIFRR56 pKa = 11.84RR57 pKa = 3.83
MM1 pKa = 7.48LKK3 pKa = 10.73ALILAILIMFVLLILLRR20 pKa = 11.84RR21 pKa = 11.84IPAIRR26 pKa = 11.84TWMNNLLRR34 pKa = 11.84QPLVRR39 pKa = 11.84SILFQGLWRR48 pKa = 11.84LIRR51 pKa = 11.84FLIFRR56 pKa = 11.84RR57 pKa = 3.83
Molecular weight: 6.96 kDa
Isoelectric point according different methods:
Peptides (in silico digests for buttom-up proteomics)
Below you can find in silico digests of the whole proteome with Trypsin, Chymotrypsin, Trypsin+LysC, LysN, ArgC proteases suitable for different mass spec machines.| Try ESI |
 |
|---|
| ChTry ESI |
 |
|---|
| ArgC ESI |
 |
|---|
| LysN ESI |
 |
|---|
| TryLysC ESI |
 |
|---|
| Try MALDI |
 |
|---|
| ChTry MALDI |
 |
|---|
| ArgC MALDI |
 |
|---|
| LysN MALDI |
 |
|---|
| TryLysC MALDI |
 |
|---|
| Try LTQ |
 |
|---|
| ChTry LTQ |
 |
|---|
| ArgC LTQ |
 |
|---|
| LysN LTQ |
 |
|---|
| TryLysC LTQ |
 |
|---|
| Try MSlow |
 |
|---|
| ChTry MSlow |
 |
|---|
| ArgC MSlow |
 |
|---|
| LysN MSlow |
 |
|---|
| TryLysC MSlow |
 |
|---|
| Try MShigh |
 |
|---|
| ChTry MShigh |
 |
|---|
| ArgC MShigh |
 |
|---|
| LysN MShigh |
 |
|---|
| TryLysC MShigh |
 |
|---|
General Statistics
Number of major isoforms |
Number of additional isoforms |
Number of all proteins |
Number of amino acids |
Min. Seq. Length |
Max. Seq. Length |
Avg. Seq. Length |
Avg. Mol. Weight |
|---|---|---|---|---|---|---|---|
0 |
749038 |
29 |
7426 |
320.9 |
35.01 |
Amino acid frequency
Ala |
Cys |
Asp |
Glu |
Phe |
Gly |
His |
Ile |
Lys |
Leu |
|---|---|---|---|---|---|---|---|---|---|
10.994 ± 0.062 | 1.136 ± 0.019 |
6.145 ± 0.051 | 5.364 ± 0.045 |
3.983 ± 0.042 | 7.975 ± 0.061 |
2.258 ± 0.03 | 5.799 ± 0.038 |
3.88 ± 0.041 | 10.183 ± 0.087 |
Met |
Asn |
Gln |
Pro |
Arg |
Ser |
Thr |
Val |
Trp |
Tyr |
|---|---|---|---|---|---|---|---|---|---|
2.677 ± 0.029 | 3.149 ± 0.062 |
4.453 ± 0.048 | 4.097 ± 0.032 |
5.534 ± 0.051 | 6.344 ± 0.06 |
5.564 ± 0.063 | 6.809 ± 0.048 |
1.232 ± 0.023 | 2.426 ± 0.023 |
Most of the basic statistics you can see at this page can be downloaded from this CSV file
Proteome-pI is available under Creative Commons Attribution-NoDerivs license, for more details see here
| Reference: Kozlowski LP. Proteome-pI 2.0: Proteome Isoelectric Point Database Update. Nucleic Acids Res. 2021, doi: 10.1093/nar/gkab944 | Contact: Lukasz P. Kozlowski |
