Stenotrophomonas phage IME13
Taxonomy: Viruses; Duplodnaviria; Heunggongvirae; Uroviricota; Caudoviricetes; Caudovirales; Myoviridae; Tulanevirus; Stenotrophomonas virus IME13
Average proteome isoelectric point is 6.23
Get precalculated fractions of proteins

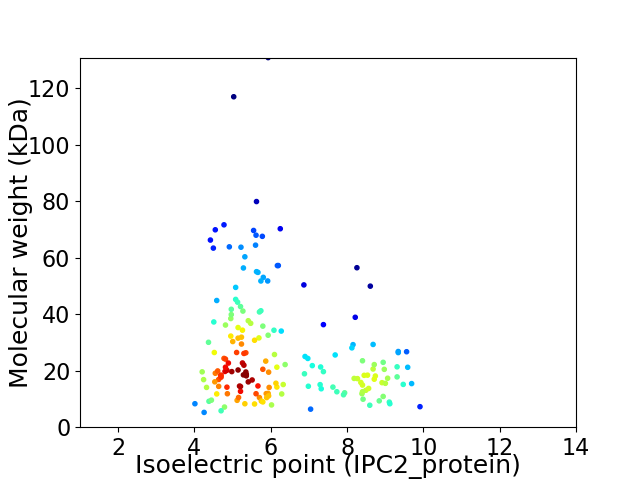
Virtual 2D-PAGE plot for 178 proteins (isoelectric point calculated using IPC2_protein)
Get csv file with sequences according to given criteria:
* You can choose from 21 different methods for calculating isoelectric point
Summary statistics related to proteome-wise predictions


Protein with the lowest isoelectric point:
>tr|J7HXN0|J7HXN0_9CAUD Ribonucleoside-diphosphate reductase OS=Stenotrophomonas phage IME13 OX=1211280 PE=3 SV=1
MM1 pKa = 7.45QKK3 pKa = 9.55QLKK6 pKa = 8.15MGIMTAFVAALSGCGEE22 pKa = 4.12QQSDD26 pKa = 3.74TFSYY30 pKa = 10.79NGLGGEE36 pKa = 4.18PTPTVTATSAEE47 pKa = 4.15QCQEE51 pKa = 3.88LGGGSTEE58 pKa = 4.05QCQLALKK65 pKa = 8.95QAKK68 pKa = 9.6DD69 pKa = 3.58EE70 pKa = 5.25HH71 pKa = 8.07ISAAPKK77 pKa = 10.66FNDD80 pKa = 3.22QTSCEE85 pKa = 4.38SGTGAVCTQTQIQNSDD101 pKa = 2.98GSFSDD106 pKa = 3.72VFVTAMVGMIVGQLMSSNARR126 pKa = 11.84PDD128 pKa = 3.39ASICAEE134 pKa = 4.01PTT136 pKa = 3.17
MM1 pKa = 7.45QKK3 pKa = 9.55QLKK6 pKa = 8.15MGIMTAFVAALSGCGEE22 pKa = 4.12QQSDD26 pKa = 3.74TFSYY30 pKa = 10.79NGLGGEE36 pKa = 4.18PTPTVTATSAEE47 pKa = 4.15QCQEE51 pKa = 3.88LGGGSTEE58 pKa = 4.05QCQLALKK65 pKa = 8.95QAKK68 pKa = 9.6DD69 pKa = 3.58EE70 pKa = 5.25HH71 pKa = 8.07ISAAPKK77 pKa = 10.66FNDD80 pKa = 3.22QTSCEE85 pKa = 4.38SGTGAVCTQTQIQNSDD101 pKa = 2.98GSFSDD106 pKa = 3.72VFVTAMVGMIVGQLMSSNARR126 pKa = 11.84PDD128 pKa = 3.39ASICAEE134 pKa = 4.01PTT136 pKa = 3.17
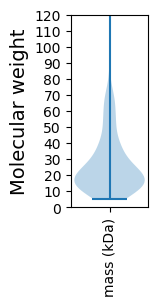
Molecular weight: 14.1 kDa
Isoelectric point according different methods:
Protein with the highest isoelectric point:
>tr|J7I4B1|J7I4B1_9CAUD DNA-directed DNA polymerase OS=Stenotrophomonas phage IME13 OX=1211280 PE=3 SV=1
MM1 pKa = 6.7KK2 pKa = 10.42QNYY5 pKa = 8.83AWLAYY10 pKa = 10.24HH11 pKa = 6.85FGLVPANGCKK21 pKa = 10.18YY22 pKa = 8.02GTRR25 pKa = 11.84GFTFANNNPHH35 pKa = 5.88FAKK38 pKa = 10.6FISTEE43 pKa = 4.03DD44 pKa = 3.04FCAILRR50 pKa = 11.84VARR53 pKa = 11.84HH54 pKa = 6.05CFLKK58 pKa = 10.22GRR60 pKa = 11.84EE61 pKa = 4.27VAVHH65 pKa = 6.03DD66 pKa = 4.72HH67 pKa = 7.04DD68 pKa = 4.44RR69 pKa = 11.84LIYY72 pKa = 10.36GCLSGADD79 pKa = 3.47EE80 pKa = 4.38LFIRR84 pKa = 11.84SRR86 pKa = 11.84DD87 pKa = 3.4TRR89 pKa = 11.84KK90 pKa = 10.46LKK92 pKa = 10.34FQFWLSKK99 pKa = 10.53SATHH103 pKa = 6.37HH104 pKa = 5.09VLNRR108 pKa = 11.84VINTDD113 pKa = 3.85FRR115 pKa = 11.84WIQRR119 pKa = 11.84TKK121 pKa = 10.72RR122 pKa = 11.84GPKK125 pKa = 8.99WISKK129 pKa = 9.96
MM1 pKa = 6.7KK2 pKa = 10.42QNYY5 pKa = 8.83AWLAYY10 pKa = 10.24HH11 pKa = 6.85FGLVPANGCKK21 pKa = 10.18YY22 pKa = 8.02GTRR25 pKa = 11.84GFTFANNNPHH35 pKa = 5.88FAKK38 pKa = 10.6FISTEE43 pKa = 4.03DD44 pKa = 3.04FCAILRR50 pKa = 11.84VARR53 pKa = 11.84HH54 pKa = 6.05CFLKK58 pKa = 10.22GRR60 pKa = 11.84EE61 pKa = 4.27VAVHH65 pKa = 6.03DD66 pKa = 4.72HH67 pKa = 7.04DD68 pKa = 4.44RR69 pKa = 11.84LIYY72 pKa = 10.36GCLSGADD79 pKa = 3.47EE80 pKa = 4.38LFIRR84 pKa = 11.84SRR86 pKa = 11.84DD87 pKa = 3.4TRR89 pKa = 11.84KK90 pKa = 10.46LKK92 pKa = 10.34FQFWLSKK99 pKa = 10.53SATHH103 pKa = 6.37HH104 pKa = 5.09VLNRR108 pKa = 11.84VINTDD113 pKa = 3.85FRR115 pKa = 11.84WIQRR119 pKa = 11.84TKK121 pKa = 10.72RR122 pKa = 11.84GPKK125 pKa = 8.99WISKK129 pKa = 9.96
Molecular weight: 15.16 kDa
Isoelectric point according different methods:
Peptides (in silico digests for buttom-up proteomics)
Below you can find in silico digests of the whole proteome with Trypsin, Chymotrypsin, Trypsin+LysC, LysN, ArgC proteases suitable for different mass spec machines.| Try ESI |
 |
|---|
| ChTry ESI |
 |
|---|
| ArgC ESI |
 |
|---|
| LysN ESI |
 |
|---|
| TryLysC ESI |
 |
|---|
| Try MALDI |
 |
|---|
| ChTry MALDI |
 |
|---|
| ArgC MALDI |
 |
|---|
| LysN MALDI |
 |
|---|
| TryLysC MALDI |
 |
|---|
| Try LTQ |
 |
|---|
| ChTry LTQ |
 |
|---|
| ArgC LTQ |
 |
|---|
| LysN LTQ |
 |
|---|
| TryLysC LTQ |
 |
|---|
| Try MSlow |
 |
|---|
| ChTry MSlow |
 |
|---|
| ArgC MSlow |
 |
|---|
| LysN MSlow |
 |
|---|
| TryLysC MSlow |
 |
|---|
| Try MShigh |
 |
|---|
| ChTry MShigh |
 |
|---|
| ArgC MShigh |
 |
|---|
| LysN MShigh |
 |
|---|
| TryLysC MShigh |
 |
|---|
General Statistics
Number of major isoforms |
Number of additional isoforms |
Number of all proteins |
Number of amino acids |
Min. Seq. Length |
Max. Seq. Length |
Avg. Seq. Length |
Avg. Mol. Weight |
|---|---|---|---|---|---|---|---|
0 |
43166 |
43 |
1220 |
242.5 |
27.46 |
Amino acid frequency
Ala |
Cys |
Asp |
Glu |
Phe |
Gly |
His |
Ile |
Lys |
Leu |
|---|---|---|---|---|---|---|---|---|---|
6.973 ± 0.188 | 1.126 ± 0.075 |
6.283 ± 0.117 | 6.829 ± 0.197 |
4.362 ± 0.122 | 6.197 ± 0.163 |
2.015 ± 0.101 | 7.019 ± 0.135 |
6.894 ± 0.193 | 7.293 ± 0.142 |
Met |
Asn |
Gln |
Pro |
Arg |
Ser |
Thr |
Val |
Trp |
Tyr |
|---|---|---|---|---|---|---|---|---|---|
2.975 ± 0.087 | 5.643 ± 0.115 |
3.621 ± 0.086 | 3.447 ± 0.111 |
4.86 ± 0.122 | 6.584 ± 0.145 |
5.757 ± 0.251 | 6.639 ± 0.141 |
1.374 ± 0.076 | 4.107 ± 0.143 |
Most of the basic statistics you can see at this page can be downloaded from this CSV file
Proteome-pI is available under Creative Commons Attribution-NoDerivs license, for more details see here
| Reference: Kozlowski LP. Proteome-pI 2.0: Proteome Isoelectric Point Database Update. Nucleic Acids Res. 2021, doi: 10.1093/nar/gkab944 | Contact: Lukasz P. Kozlowski |
