Erythrobacter neustonensis
Taxonomy: cellular organisms; Bacteria; Proteobacteria; Alphaproteobacteria; Sphingomonadales; Erythrobacteraceae; Erythrobacter/Porphyrobacter group; Erythrobacter
Average proteome isoelectric point is 6.29
Get precalculated fractions of proteins

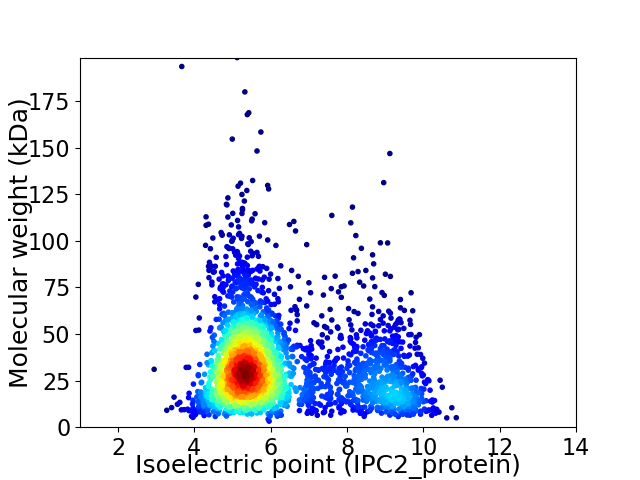
Virtual 2D-PAGE plot for 2792 proteins (isoelectric point calculated using IPC2_protein)
Get csv file with sequences according to given criteria:
* You can choose from 21 different methods for calculating isoelectric point
Summary statistics related to proteome-wise predictions


Protein with the lowest isoelectric point:
>tr|A0A192D498|A0A192D498_9SPHN Flagellar biosynthetic protein FliQ OS=Erythrobacter neustonensis OX=1112 GN=A9D12_06120 PE=3 SV=1
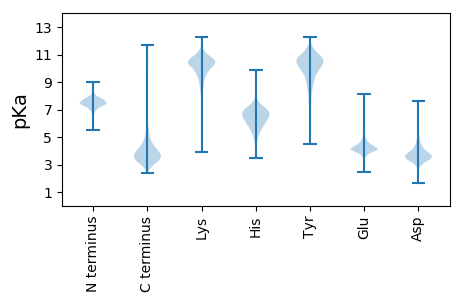
MM1 pKa = 7.82FIRR4 pKa = 11.84FASAASAVALSACFAAPALAGEE26 pKa = 4.37ADD28 pKa = 3.59AAIVGPAAEE37 pKa = 4.26TEE39 pKa = 4.14IMISEE44 pKa = 4.61TAADD48 pKa = 3.95TAAGTPARR56 pKa = 11.84APINLDD62 pKa = 3.16EE63 pKa = 5.09ATGQDD68 pKa = 3.66DD69 pKa = 4.12AAPALTVSGSATLASDD85 pKa = 3.31YY86 pKa = 10.66RR87 pKa = 11.84FRR89 pKa = 11.84GVSQTDD95 pKa = 2.52EE96 pKa = 4.03GMAVQGGVTLSHH108 pKa = 6.67SSGFYY113 pKa = 9.84FGAWGSNLAGWGTFGGANMEE133 pKa = 4.4LDD135 pKa = 3.99LFAGFKK141 pKa = 10.62VPVGEE146 pKa = 4.34GTLDD150 pKa = 5.02LGGTWYY156 pKa = 9.0MYY158 pKa = 10.48PSGADD163 pKa = 3.06EE164 pKa = 4.11TDD166 pKa = 3.44FAEE169 pKa = 5.78LYY171 pKa = 10.73AKK173 pKa = 10.75LSGTAGPLGLTATVAYY189 pKa = 10.1APKK192 pKa = 10.39QEE194 pKa = 4.19ALGNAFPVGLPADD207 pKa = 4.6PGDD210 pKa = 4.59KK211 pKa = 10.46EE212 pKa = 4.68DD213 pKa = 3.98NLYY216 pKa = 10.87LAGDD220 pKa = 3.8AVYY223 pKa = 10.43AVGDD227 pKa = 3.98SPVSLKK233 pKa = 11.05AHH235 pKa = 6.75IGYY238 pKa = 9.98SDD240 pKa = 3.96GNPGLGPNGTSIAPTGTYY258 pKa = 10.19FDD260 pKa = 4.04WLVGIDD266 pKa = 4.56FVATPGLTFSAAYY279 pKa = 9.99VDD281 pKa = 3.94TDD283 pKa = 3.12ISEE286 pKa = 4.81AEE288 pKa = 4.13ANRR291 pKa = 11.84IRR293 pKa = 11.84PNFATLDD300 pKa = 3.76GNSISDD306 pKa = 3.53ATVVLSVTASFF317 pKa = 4.2
MM1 pKa = 7.82FIRR4 pKa = 11.84FASAASAVALSACFAAPALAGEE26 pKa = 4.37ADD28 pKa = 3.59AAIVGPAAEE37 pKa = 4.26TEE39 pKa = 4.14IMISEE44 pKa = 4.61TAADD48 pKa = 3.95TAAGTPARR56 pKa = 11.84APINLDD62 pKa = 3.16EE63 pKa = 5.09ATGQDD68 pKa = 3.66DD69 pKa = 4.12AAPALTVSGSATLASDD85 pKa = 3.31YY86 pKa = 10.66RR87 pKa = 11.84FRR89 pKa = 11.84GVSQTDD95 pKa = 2.52EE96 pKa = 4.03GMAVQGGVTLSHH108 pKa = 6.67SSGFYY113 pKa = 9.84FGAWGSNLAGWGTFGGANMEE133 pKa = 4.4LDD135 pKa = 3.99LFAGFKK141 pKa = 10.62VPVGEE146 pKa = 4.34GTLDD150 pKa = 5.02LGGTWYY156 pKa = 9.0MYY158 pKa = 10.48PSGADD163 pKa = 3.06EE164 pKa = 4.11TDD166 pKa = 3.44FAEE169 pKa = 5.78LYY171 pKa = 10.73AKK173 pKa = 10.75LSGTAGPLGLTATVAYY189 pKa = 10.1APKK192 pKa = 10.39QEE194 pKa = 4.19ALGNAFPVGLPADD207 pKa = 4.6PGDD210 pKa = 4.59KK211 pKa = 10.46EE212 pKa = 4.68DD213 pKa = 3.98NLYY216 pKa = 10.87LAGDD220 pKa = 3.8AVYY223 pKa = 10.43AVGDD227 pKa = 3.98SPVSLKK233 pKa = 11.05AHH235 pKa = 6.75IGYY238 pKa = 9.98SDD240 pKa = 3.96GNPGLGPNGTSIAPTGTYY258 pKa = 10.19FDD260 pKa = 4.04WLVGIDD266 pKa = 4.56FVATPGLTFSAAYY279 pKa = 9.99VDD281 pKa = 3.94TDD283 pKa = 3.12ISEE286 pKa = 4.81AEE288 pKa = 4.13ANRR291 pKa = 11.84IRR293 pKa = 11.84PNFATLDD300 pKa = 3.76GNSISDD306 pKa = 3.53ATVVLSVTASFF317 pKa = 4.2
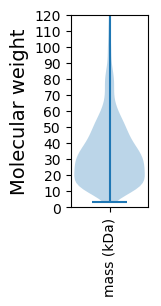
Molecular weight: 32.09 kDa
Isoelectric point according different methods:
Protein with the highest isoelectric point:
>tr|A0A192D0T9|A0A192D0T9_9SPHN Uncharacterized protein OS=Erythrobacter neustonensis OX=1112 GN=A9D12_01055 PE=4 SV=1
MM1 pKa = 7.45KK2 pKa = 9.61RR3 pKa = 11.84TFQPSNLVRR12 pKa = 11.84ARR14 pKa = 11.84RR15 pKa = 11.84HH16 pKa = 4.89GFFARR21 pKa = 11.84KK22 pKa = 7.57ATPGGQKK29 pKa = 9.19VLRR32 pKa = 11.84ARR34 pKa = 11.84RR35 pKa = 11.84ARR37 pKa = 11.84GRR39 pKa = 11.84KK40 pKa = 8.81KK41 pKa = 10.46LCAA44 pKa = 3.96
MM1 pKa = 7.45KK2 pKa = 9.61RR3 pKa = 11.84TFQPSNLVRR12 pKa = 11.84ARR14 pKa = 11.84RR15 pKa = 11.84HH16 pKa = 4.89GFFARR21 pKa = 11.84KK22 pKa = 7.57ATPGGQKK29 pKa = 9.19VLRR32 pKa = 11.84ARR34 pKa = 11.84RR35 pKa = 11.84ARR37 pKa = 11.84GRR39 pKa = 11.84KK40 pKa = 8.81KK41 pKa = 10.46LCAA44 pKa = 3.96
Molecular weight: 5.08 kDa
Isoelectric point according different methods:
Peptides (in silico digests for buttom-up proteomics)
Below you can find in silico digests of the whole proteome with Trypsin, Chymotrypsin, Trypsin+LysC, LysN, ArgC proteases suitable for different mass spec machines.| Try ESI |
 |
|---|
| ChTry ESI |
 |
|---|
| ArgC ESI |
 |
|---|
| LysN ESI |
 |
|---|
| TryLysC ESI |
 |
|---|
| Try MALDI |
 |
|---|
| ChTry MALDI |
 |
|---|
| ArgC MALDI |
 |
|---|
| LysN MALDI |
 |
|---|
| TryLysC MALDI |
 |
|---|
| Try LTQ |
 |
|---|
| ChTry LTQ |
 |
|---|
| ArgC LTQ |
 |
|---|
| LysN LTQ |
 |
|---|
| TryLysC LTQ |
 |
|---|
| Try MSlow |
 |
|---|
| ChTry MSlow |
 |
|---|
| ArgC MSlow |
 |
|---|
| LysN MSlow |
 |
|---|
| TryLysC MSlow |
 |
|---|
| Try MShigh |
 |
|---|
| ChTry MShigh |
 |
|---|
| ArgC MShigh |
 |
|---|
| LysN MShigh |
 |
|---|
| TryLysC MShigh |
 |
|---|
General Statistics
Number of major isoforms |
Number of additional isoforms |
Number of all proteins |
Number of amino acids |
Min. Seq. Length |
Max. Seq. Length |
Avg. Seq. Length |
Avg. Mol. Weight |
|---|---|---|---|---|---|---|---|
0 |
918342 |
29 |
1954 |
328.9 |
35.35 |
Amino acid frequency
Ala |
Cys |
Asp |
Glu |
Phe |
Gly |
His |
Ile |
Lys |
Leu |
|---|---|---|---|---|---|---|---|---|---|
14.318 ± 0.081 | 0.791 ± 0.013 |
5.877 ± 0.038 | 5.564 ± 0.041 |
3.591 ± 0.033 | 9.019 ± 0.045 |
1.919 ± 0.025 | 4.969 ± 0.026 |
2.873 ± 0.034 | 9.9 ± 0.051 |
Met |
Asn |
Gln |
Pro |
Arg |
Ser |
Thr |
Val |
Trp |
Tyr |
|---|---|---|---|---|---|---|---|---|---|
2.46 ± 0.022 | 2.488 ± 0.027 |
5.327 ± 0.031 | 3.097 ± 0.023 |
7.116 ± 0.044 | 4.867 ± 0.027 |
5.286 ± 0.035 | 7.064 ± 0.033 |
1.389 ± 0.02 | 2.085 ± 0.024 |
Most of the basic statistics you can see at this page can be downloaded from this CSV file
Proteome-pI is available under Creative Commons Attribution-NoDerivs license, for more details see here
| Reference: Kozlowski LP. Proteome-pI 2.0: Proteome Isoelectric Point Database Update. Nucleic Acids Res. 2021, doi: 10.1093/nar/gkab944 | Contact: Lukasz P. Kozlowski |
