Rhodococcus triatomae
Taxonomy: cellular organisms; Bacteria; Terrabacteria group; Actinobacteria; Actinomycetia; Corynebacteriales; Nocardiaceae; Rhodococcus
Average proteome isoelectric point is 5.87
Get precalculated fractions of proteins

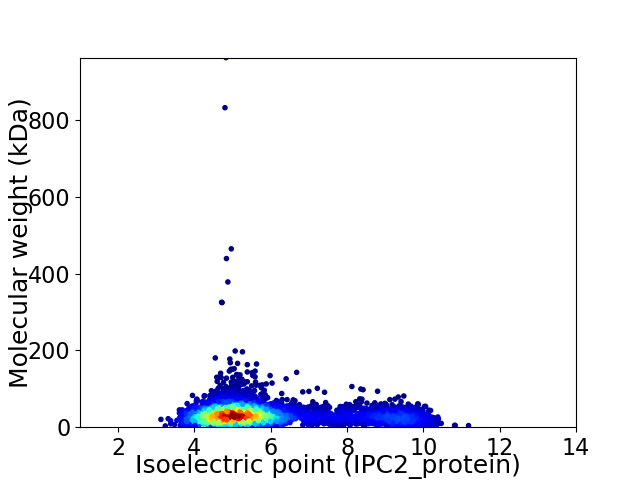
Virtual 2D-PAGE plot for 4426 proteins (isoelectric point calculated using IPC2_protein)
Get csv file with sequences according to given criteria:
* You can choose from 21 different methods for calculating isoelectric point
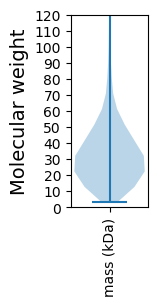
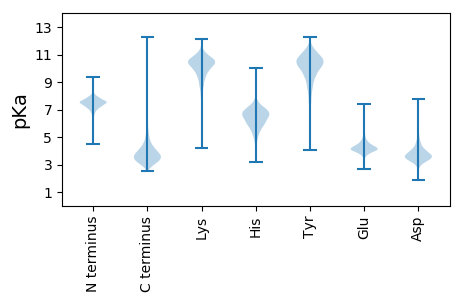
Summary statistics related to proteome-wise predictions


Protein with the lowest isoelectric point:
>tr|A0A1G8F244|A0A1G8F244_9NOCA Uncharacterized protein OS=Rhodococcus triatomae OX=300028 GN=SAMN05444695_103146 PE=3 SV=1
MM1 pKa = 7.05NHH3 pKa = 6.39IPDD6 pKa = 4.63PEE8 pKa = 4.09EE9 pKa = 5.16SPDD12 pKa = 3.54GPVFEE17 pKa = 5.1GRR19 pKa = 11.84LLVRR23 pKa = 11.84PGDD26 pKa = 3.89EE27 pKa = 4.89IVDD30 pKa = 3.54QGAGFDD36 pKa = 3.23IATLVTRR43 pKa = 11.84RR44 pKa = 11.84RR45 pKa = 11.84VLSVLGVGAGALALAACSGGQARR68 pKa = 11.84TSSTTTTSASSTASEE83 pKa = 4.73EE84 pKa = 4.19IPEE87 pKa = 4.42EE88 pKa = 4.24TNGPYY93 pKa = 9.99PADD96 pKa = 3.46GTNGVNVLEE105 pKa = 4.3EE106 pKa = 4.33SGLVRR111 pKa = 11.84RR112 pKa = 11.84DD113 pKa = 3.41LTSSLDD119 pKa = 3.21GGTTVDD125 pKa = 3.65GTPLSFTFTVTDD137 pKa = 3.61MANDD141 pKa = 3.5NVPFEE146 pKa = 4.37GVAVYY151 pKa = 9.62AWQCDD156 pKa = 3.44AAGLYY161 pKa = 10.82SMYY164 pKa = 10.79SEE166 pKa = 4.18GVEE169 pKa = 4.0DD170 pKa = 3.49EE171 pKa = 4.51TYY173 pKa = 11.15LRR175 pKa = 11.84GIQIADD181 pKa = 3.53AEE183 pKa = 4.6GQVTLEE189 pKa = 4.35TIVPGCYY196 pKa = 8.81TGRR199 pKa = 11.84WTHH202 pKa = 5.39IHH204 pKa = 6.26FEE206 pKa = 4.26IYY208 pKa = 10.02PDD210 pKa = 3.95GDD212 pKa = 3.55SATDD216 pKa = 3.46VEE218 pKa = 4.44NAIATSQVAFPQDD231 pKa = 3.5MLDD234 pKa = 3.12EE235 pKa = 4.82VYY237 pKa = 10.68QLEE240 pKa = 4.81TYY242 pKa = 10.46AGSARR247 pKa = 11.84NLAAIGGLEE256 pKa = 3.87NDD258 pKa = 3.61NVFGDD263 pKa = 4.4GYY265 pKa = 8.92EE266 pKa = 4.08LQMGTFSGDD275 pKa = 3.24PDD277 pKa = 3.52SGYY280 pKa = 11.23VGSLPVAVDD289 pKa = 3.41TTTEE293 pKa = 3.99PAATGAPPGGPGGGAGPGGGRR314 pKa = 11.84PPGDD318 pKa = 3.52GGPPPGAPPNN328 pKa = 3.77
MM1 pKa = 7.05NHH3 pKa = 6.39IPDD6 pKa = 4.63PEE8 pKa = 4.09EE9 pKa = 5.16SPDD12 pKa = 3.54GPVFEE17 pKa = 5.1GRR19 pKa = 11.84LLVRR23 pKa = 11.84PGDD26 pKa = 3.89EE27 pKa = 4.89IVDD30 pKa = 3.54QGAGFDD36 pKa = 3.23IATLVTRR43 pKa = 11.84RR44 pKa = 11.84RR45 pKa = 11.84VLSVLGVGAGALALAACSGGQARR68 pKa = 11.84TSSTTTTSASSTASEE83 pKa = 4.73EE84 pKa = 4.19IPEE87 pKa = 4.42EE88 pKa = 4.24TNGPYY93 pKa = 9.99PADD96 pKa = 3.46GTNGVNVLEE105 pKa = 4.3EE106 pKa = 4.33SGLVRR111 pKa = 11.84RR112 pKa = 11.84DD113 pKa = 3.41LTSSLDD119 pKa = 3.21GGTTVDD125 pKa = 3.65GTPLSFTFTVTDD137 pKa = 3.61MANDD141 pKa = 3.5NVPFEE146 pKa = 4.37GVAVYY151 pKa = 9.62AWQCDD156 pKa = 3.44AAGLYY161 pKa = 10.82SMYY164 pKa = 10.79SEE166 pKa = 4.18GVEE169 pKa = 4.0DD170 pKa = 3.49EE171 pKa = 4.51TYY173 pKa = 11.15LRR175 pKa = 11.84GIQIADD181 pKa = 3.53AEE183 pKa = 4.6GQVTLEE189 pKa = 4.35TIVPGCYY196 pKa = 8.81TGRR199 pKa = 11.84WTHH202 pKa = 5.39IHH204 pKa = 6.26FEE206 pKa = 4.26IYY208 pKa = 10.02PDD210 pKa = 3.95GDD212 pKa = 3.55SATDD216 pKa = 3.46VEE218 pKa = 4.44NAIATSQVAFPQDD231 pKa = 3.5MLDD234 pKa = 3.12EE235 pKa = 4.82VYY237 pKa = 10.68QLEE240 pKa = 4.81TYY242 pKa = 10.46AGSARR247 pKa = 11.84NLAAIGGLEE256 pKa = 3.87NDD258 pKa = 3.61NVFGDD263 pKa = 4.4GYY265 pKa = 8.92EE266 pKa = 4.08LQMGTFSGDD275 pKa = 3.24PDD277 pKa = 3.52SGYY280 pKa = 11.23VGSLPVAVDD289 pKa = 3.41TTTEE293 pKa = 3.99PAATGAPPGGPGGGAGPGGGRR314 pKa = 11.84PPGDD318 pKa = 3.52GGPPPGAPPNN328 pKa = 3.77
Molecular weight: 33.61 kDa
Isoelectric point according different methods:
Protein with the highest isoelectric point:
>tr|A0A1G8J7T0|A0A1G8J7T0_9NOCA Clp amino terminal domain-containing protein pathogenicity island component OS=Rhodococcus triatomae OX=300028 GN=G4H72_14615 PE=4 SV=1
MM1 pKa = 7.4GSVIKK6 pKa = 10.38KK7 pKa = 8.42RR8 pKa = 11.84RR9 pKa = 11.84KK10 pKa = 9.06RR11 pKa = 11.84MSKK14 pKa = 9.76KK15 pKa = 9.54KK16 pKa = 9.72HH17 pKa = 5.63RR18 pKa = 11.84KK19 pKa = 7.56LLRR22 pKa = 11.84RR23 pKa = 11.84TRR25 pKa = 11.84VQRR28 pKa = 11.84RR29 pKa = 11.84KK30 pKa = 10.11LGKK33 pKa = 9.87
MM1 pKa = 7.4GSVIKK6 pKa = 10.38KK7 pKa = 8.42RR8 pKa = 11.84RR9 pKa = 11.84KK10 pKa = 9.06RR11 pKa = 11.84MSKK14 pKa = 9.76KK15 pKa = 9.54KK16 pKa = 9.72HH17 pKa = 5.63RR18 pKa = 11.84KK19 pKa = 7.56LLRR22 pKa = 11.84RR23 pKa = 11.84TRR25 pKa = 11.84VQRR28 pKa = 11.84RR29 pKa = 11.84KK30 pKa = 10.11LGKK33 pKa = 9.87
Molecular weight: 4.15 kDa
Isoelectric point according different methods:
Peptides (in silico digests for buttom-up proteomics)
Below you can find in silico digests of the whole proteome with Trypsin, Chymotrypsin, Trypsin+LysC, LysN, ArgC proteases suitable for different mass spec machines.| Try ESI |
 |
|---|
| ChTry ESI |
 |
|---|
| ArgC ESI |
 |
|---|
| LysN ESI |
 |
|---|
| TryLysC ESI |
 |
|---|
| Try MALDI |
 |
|---|
| ChTry MALDI |
 |
|---|
| ArgC MALDI |
 |
|---|
| LysN MALDI |
 |
|---|
| TryLysC MALDI |
 |
|---|
| Try LTQ |
 |
|---|
| ChTry LTQ |
 |
|---|
| ArgC LTQ |
 |
|---|
| LysN LTQ |
 |
|---|
| TryLysC LTQ |
 |
|---|
| Try MSlow |
 |
|---|
| ChTry MSlow |
 |
|---|
| ArgC MSlow |
 |
|---|
| LysN MSlow |
 |
|---|
| TryLysC MSlow |
 |
|---|
| Try MShigh |
 |
|---|
| ChTry MShigh |
 |
|---|
| ArgC MShigh |
 |
|---|
| LysN MShigh |
 |
|---|
| TryLysC MShigh |
 |
|---|
General Statistics
Number of major isoforms |
Number of additional isoforms |
Number of all proteins |
Number of amino acids |
Min. Seq. Length |
Max. Seq. Length |
Avg. Seq. Length |
Avg. Mol. Weight |
|---|---|---|---|---|---|---|---|
0 |
1436612 |
30 |
8970 |
324.6 |
34.71 |
Amino acid frequency
Ala |
Cys |
Asp |
Glu |
Phe |
Gly |
His |
Ile |
Lys |
Leu |
|---|---|---|---|---|---|---|---|---|---|
13.04 ± 0.044 | 0.681 ± 0.011 |
6.511 ± 0.031 | 5.733 ± 0.03 |
2.953 ± 0.017 | 9.24 ± 0.029 |
2.144 ± 0.018 | 3.846 ± 0.025 |
1.755 ± 0.025 | 9.935 ± 0.038 |
Met |
Asn |
Gln |
Pro |
Arg |
Ser |
Thr |
Val |
Trp |
Tyr |
|---|---|---|---|---|---|---|---|---|---|
1.79 ± 0.016 | 1.778 ± 0.018 |
5.77 ± 0.036 | 2.563 ± 0.02 |
7.697 ± 0.036 | 5.574 ± 0.026 |
6.215 ± 0.028 | 9.344 ± 0.037 |
1.431 ± 0.016 | 1.999 ± 0.016 |
Most of the basic statistics you can see at this page can be downloaded from this CSV file
Proteome-pI is available under Creative Commons Attribution-NoDerivs license, for more details see here
| Reference: Kozlowski LP. Proteome-pI 2.0: Proteome Isoelectric Point Database Update. Nucleic Acids Res. 2021, doi: 10.1093/nar/gkab944 | Contact: Lukasz P. Kozlowski |
