Microvirga tunisiensis
Taxonomy: cellular organisms; Bacteria; Proteobacteria; Alphaproteobacteria; Hyphomicrobiales; Methylobacteriaceae; Microvirga
Average proteome isoelectric point is 6.73
Get precalculated fractions of proteins

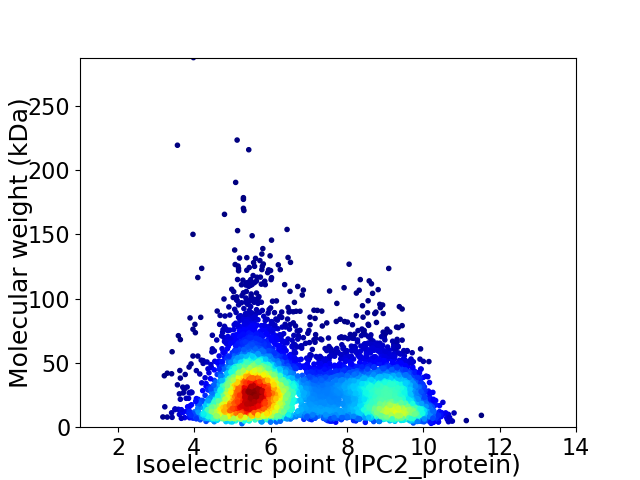
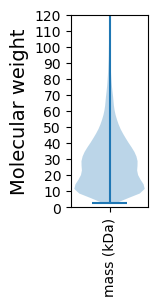
Virtual 2D-PAGE plot for 7944 proteins (isoelectric point calculated using IPC2_protein)
Get csv file with sequences according to given criteria:
* You can choose from 21 different methods for calculating isoelectric point
Summary statistics related to proteome-wise predictions


Protein with the lowest isoelectric point:
>tr|A0A5N7MX17|A0A5N7MX17_9RHIZ Transposase OS=Microvirga tunisiensis OX=2108360 GN=FS320_43330 PE=4 SV=1
MM1 pKa = 8.17DD2 pKa = 5.26SGDD5 pKa = 3.4ISVPGYY11 pKa = 10.17IWTGDD16 pKa = 3.42AGDD19 pKa = 3.77NAIAGTNGADD29 pKa = 3.44TMAGGAGNDD38 pKa = 3.58EE39 pKa = 4.35YY40 pKa = 11.13TVNHH44 pKa = 6.41SGDD47 pKa = 3.92LVTEE51 pKa = 4.17NAGEE55 pKa = 4.41GTDD58 pKa = 3.75HH59 pKa = 6.88VYY61 pKa = 11.25SSITYY66 pKa = 7.76TLTPNVEE73 pKa = 4.01NLTLTGTGAINGYY86 pKa = 10.89GNGLNNWIVGNAAVNTLKK104 pKa = 10.71SDD106 pKa = 4.5DD107 pKa = 4.65GDD109 pKa = 3.8DD110 pKa = 3.82TLDD113 pKa = 3.79GGGGADD119 pKa = 4.82SLDD122 pKa = 3.75GGNGNDD128 pKa = 3.4TYY130 pKa = 11.55YY131 pKa = 11.16VDD133 pKa = 4.74DD134 pKa = 4.38AADD137 pKa = 3.75VIVEE141 pKa = 4.21KK142 pKa = 10.85DD143 pKa = 3.37SLGLGGYY150 pKa = 8.92DD151 pKa = 3.12HH152 pKa = 6.97VFSSVSYY159 pKa = 9.33VLSAQVEE166 pKa = 4.52EE167 pKa = 4.37LTLTGSANLNATGNTGANVLNGNDD191 pKa = 4.04GDD193 pKa = 4.16NALDD197 pKa = 3.63GHH199 pKa = 6.54GGADD203 pKa = 3.48TMNGGLGNDD212 pKa = 3.76TYY214 pKa = 11.63YY215 pKa = 10.99VDD217 pKa = 3.94HH218 pKa = 7.19SGDD221 pKa = 3.7VVNEE225 pKa = 3.66AAGAGGGVDD234 pKa = 3.56TVISSVSISSTKK246 pKa = 9.84PLAANVEE253 pKa = 4.21NLVLTGLATEE263 pKa = 4.59GTGNGLDD270 pKa = 3.49NVITGRR276 pKa = 11.84PYY278 pKa = 9.17VRR280 pKa = 11.84CRR282 pKa = 11.84RR283 pKa = 11.84RR284 pKa = 11.84WLVHH288 pKa = 4.47TMRR291 pKa = 5.84
MM1 pKa = 8.17DD2 pKa = 5.26SGDD5 pKa = 3.4ISVPGYY11 pKa = 10.17IWTGDD16 pKa = 3.42AGDD19 pKa = 3.77NAIAGTNGADD29 pKa = 3.44TMAGGAGNDD38 pKa = 3.58EE39 pKa = 4.35YY40 pKa = 11.13TVNHH44 pKa = 6.41SGDD47 pKa = 3.92LVTEE51 pKa = 4.17NAGEE55 pKa = 4.41GTDD58 pKa = 3.75HH59 pKa = 6.88VYY61 pKa = 11.25SSITYY66 pKa = 7.76TLTPNVEE73 pKa = 4.01NLTLTGTGAINGYY86 pKa = 10.89GNGLNNWIVGNAAVNTLKK104 pKa = 10.71SDD106 pKa = 4.5DD107 pKa = 4.65GDD109 pKa = 3.8DD110 pKa = 3.82TLDD113 pKa = 3.79GGGGADD119 pKa = 4.82SLDD122 pKa = 3.75GGNGNDD128 pKa = 3.4TYY130 pKa = 11.55YY131 pKa = 11.16VDD133 pKa = 4.74DD134 pKa = 4.38AADD137 pKa = 3.75VIVEE141 pKa = 4.21KK142 pKa = 10.85DD143 pKa = 3.37SLGLGGYY150 pKa = 8.92DD151 pKa = 3.12HH152 pKa = 6.97VFSSVSYY159 pKa = 9.33VLSAQVEE166 pKa = 4.52EE167 pKa = 4.37LTLTGSANLNATGNTGANVLNGNDD191 pKa = 4.04GDD193 pKa = 4.16NALDD197 pKa = 3.63GHH199 pKa = 6.54GGADD203 pKa = 3.48TMNGGLGNDD212 pKa = 3.76TYY214 pKa = 11.63YY215 pKa = 10.99VDD217 pKa = 3.94HH218 pKa = 7.19SGDD221 pKa = 3.7VVNEE225 pKa = 3.66AAGAGGGVDD234 pKa = 3.56TVISSVSISSTKK246 pKa = 9.84PLAANVEE253 pKa = 4.21NLVLTGLATEE263 pKa = 4.59GTGNGLDD270 pKa = 3.49NVITGRR276 pKa = 11.84PYY278 pKa = 9.17VRR280 pKa = 11.84CRR282 pKa = 11.84RR283 pKa = 11.84RR284 pKa = 11.84WLVHH288 pKa = 4.47TMRR291 pKa = 5.84
Molecular weight: 29.45 kDa
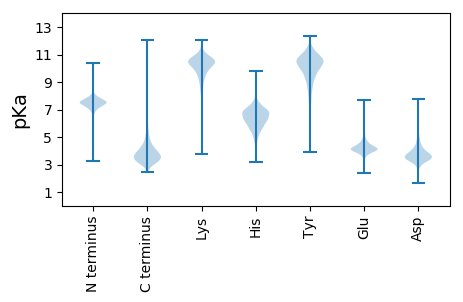
Isoelectric point according different methods:
Protein with the highest isoelectric point:
>tr|A0A5N7MBB5|A0A5N7MBB5_9RHIZ Type II secretion system F family protein OS=Microvirga tunisiensis OX=2108360 GN=FS320_02615 PE=4 SV=1
MM1 pKa = 6.9MAAATSRR8 pKa = 11.84APPAAPALRR17 pKa = 11.84RR18 pKa = 11.84RR19 pKa = 11.84ARR21 pKa = 11.84RR22 pKa = 11.84PAPARR27 pKa = 11.84PLRR30 pKa = 11.84LPRR33 pKa = 11.84RR34 pKa = 11.84LRR36 pKa = 11.84RR37 pKa = 11.84LPQPRR42 pKa = 11.84RR43 pKa = 11.84ALLPRR48 pKa = 11.84RR49 pKa = 11.84LRR51 pKa = 11.84PTRR54 pKa = 11.84SKK56 pKa = 10.09FASRR60 pKa = 11.84VTLRR64 pKa = 11.84TMGLTSGSGPFLRR77 pKa = 11.84GLPPGSS83 pKa = 3.41
MM1 pKa = 6.9MAAATSRR8 pKa = 11.84APPAAPALRR17 pKa = 11.84RR18 pKa = 11.84RR19 pKa = 11.84ARR21 pKa = 11.84RR22 pKa = 11.84PAPARR27 pKa = 11.84PLRR30 pKa = 11.84LPRR33 pKa = 11.84RR34 pKa = 11.84LRR36 pKa = 11.84RR37 pKa = 11.84LPQPRR42 pKa = 11.84RR43 pKa = 11.84ALLPRR48 pKa = 11.84RR49 pKa = 11.84LRR51 pKa = 11.84PTRR54 pKa = 11.84SKK56 pKa = 10.09FASRR60 pKa = 11.84VTLRR64 pKa = 11.84TMGLTSGSGPFLRR77 pKa = 11.84GLPPGSS83 pKa = 3.41
Molecular weight: 9.23 kDa
Isoelectric point according different methods:
Peptides (in silico digests for buttom-up proteomics)
Below you can find in silico digests of the whole proteome with Trypsin, Chymotrypsin, Trypsin+LysC, LysN, ArgC proteases suitable for different mass spec machines.| Try ESI |
 |
|---|
| ChTry ESI |
 |
|---|
| ArgC ESI |
 |
|---|
| LysN ESI |
 |
|---|
| TryLysC ESI |
 |
|---|
| Try MALDI |
 |
|---|
| ChTry MALDI |
 |
|---|
| ArgC MALDI |
 |
|---|
| LysN MALDI |
 |
|---|
| TryLysC MALDI |
 |
|---|
| Try LTQ |
 |
|---|
| ChTry LTQ |
 |
|---|
| ArgC LTQ |
 |
|---|
| LysN LTQ |
 |
|---|
| TryLysC LTQ |
 |
|---|
| Try MSlow |
 |
|---|
| ChTry MSlow |
 |
|---|
| ArgC MSlow |
 |
|---|
| LysN MSlow |
 |
|---|
| TryLysC MSlow |
 |
|---|
| Try MShigh |
 |
|---|
| ChTry MShigh |
 |
|---|
| ArgC MShigh |
 |
|---|
| LysN MShigh |
 |
|---|
| TryLysC MShigh |
 |
|---|
General Statistics
Number of major isoforms |
Number of additional isoforms |
Number of all proteins |
Number of amino acids |
Min. Seq. Length |
Max. Seq. Length |
Avg. Seq. Length |
Avg. Mol. Weight |
|---|---|---|---|---|---|---|---|
0 |
2184762 |
24 |
2831 |
275.0 |
30.03 |
Amino acid frequency
Ala |
Cys |
Asp |
Glu |
Phe |
Gly |
His |
Ile |
Lys |
Leu |
|---|---|---|---|---|---|---|---|---|---|
11.651 ± 0.032 | 0.854 ± 0.01 |
5.519 ± 0.025 | 5.927 ± 0.028 |
3.612 ± 0.019 | 8.191 ± 0.028 |
2.147 ± 0.014 | 5.213 ± 0.019 |
3.397 ± 0.024 | 10.179 ± 0.036 |
Met |
Asn |
Gln |
Pro |
Arg |
Ser |
Thr |
Val |
Trp |
Tyr |
|---|---|---|---|---|---|---|---|---|---|
2.338 ± 0.013 | 2.618 ± 0.017 |
5.296 ± 0.02 | 3.44 ± 0.017 |
7.487 ± 0.031 | 5.765 ± 0.023 |
5.389 ± 0.024 | 7.397 ± 0.026 |
1.36 ± 0.01 | 2.22 ± 0.015 |
Most of the basic statistics you can see at this page can be downloaded from this CSV file
Proteome-pI is available under Creative Commons Attribution-NoDerivs license, for more details see here
| Reference: Kozlowski LP. Proteome-pI 2.0: Proteome Isoelectric Point Database Update. Nucleic Acids Res. 2021, doi: 10.1093/nar/gkab944 | Contact: Lukasz P. Kozlowski |
