Feline immunodeficiency virus (isolate Petaluma) (FIV)
Taxonomy: Viruses; Riboviria; Pararnavirae; Artverviricota; Revtraviricetes; Ortervirales; Retroviridae; Orthoretrovirinae; Lentivirus; Feline immunodeficiency virus
Average proteome isoelectric point is 7.67
Get precalculated fractions of proteins

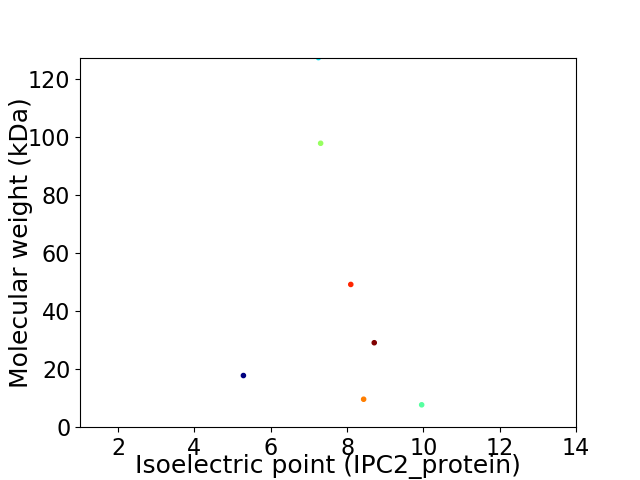
Virtual 2D-PAGE plot for 7 proteins (isoelectric point calculated using IPC2_protein)
Get csv file with sequences according to given criteria:
* You can choose from 21 different methods for calculating isoelectric point
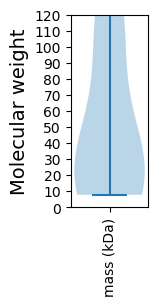
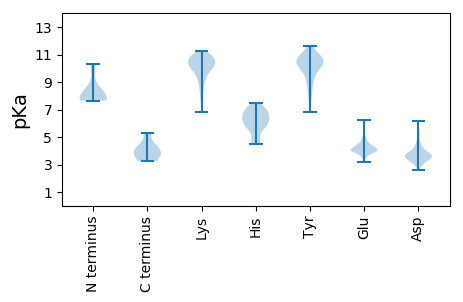
Summary statistics related to proteome-wise predictions


Protein with the lowest isoelectric point:
>sp|Q66013|VPRL_FIVPE Probable Vpr-like protein OS=Feline immunodeficiency virus (isolate Petaluma) OX=11674 PE=3 SV=1
MM1 pKa = 7.81AEE3 pKa = 3.78GFAANRR9 pKa = 11.84QWIGLEE15 pKa = 3.93EE16 pKa = 4.69AEE18 pKa = 4.66EE19 pKa = 4.21LLDD22 pKa = 5.37FDD24 pKa = 5.07IATQMSEE31 pKa = 4.42EE32 pKa = 4.73GPLNPGVNPFRR43 pKa = 11.84VPGITEE49 pKa = 3.97KK50 pKa = 10.88EE51 pKa = 3.9KK52 pKa = 11.07QNYY55 pKa = 9.11CNILQPKK62 pKa = 9.25LQDD65 pKa = 3.53LRR67 pKa = 11.84NEE69 pKa = 3.81IQEE72 pKa = 4.36VKK74 pKa = 10.76LEE76 pKa = 4.07EE77 pKa = 4.44GNAGKK82 pKa = 10.4RR83 pKa = 11.84KK84 pKa = 7.9RR85 pKa = 11.84QRR87 pKa = 11.84RR88 pKa = 11.84RR89 pKa = 11.84RR90 pKa = 11.84KK91 pKa = 8.51KK92 pKa = 9.56KK93 pKa = 9.0AFKK96 pKa = 10.9RR97 pKa = 11.84MMTEE101 pKa = 3.5LEE103 pKa = 3.87DD104 pKa = 3.71RR105 pKa = 11.84FRR107 pKa = 11.84KK108 pKa = 10.15LFGTTSTTGDD118 pKa = 3.49STVDD122 pKa = 4.21SEE124 pKa = 5.45DD125 pKa = 3.73EE126 pKa = 4.08PPKK129 pKa = 10.29KK130 pKa = 9.89EE131 pKa = 4.93KK132 pKa = 10.59RR133 pKa = 11.84VDD135 pKa = 2.81WDD137 pKa = 3.95EE138 pKa = 3.78YY139 pKa = 9.66WNPEE143 pKa = 4.03EE144 pKa = 4.34IEE146 pKa = 4.24RR147 pKa = 11.84MLMDD151 pKa = 4.17
MM1 pKa = 7.81AEE3 pKa = 3.78GFAANRR9 pKa = 11.84QWIGLEE15 pKa = 3.93EE16 pKa = 4.69AEE18 pKa = 4.66EE19 pKa = 4.21LLDD22 pKa = 5.37FDD24 pKa = 5.07IATQMSEE31 pKa = 4.42EE32 pKa = 4.73GPLNPGVNPFRR43 pKa = 11.84VPGITEE49 pKa = 3.97KK50 pKa = 10.88EE51 pKa = 3.9KK52 pKa = 11.07QNYY55 pKa = 9.11CNILQPKK62 pKa = 9.25LQDD65 pKa = 3.53LRR67 pKa = 11.84NEE69 pKa = 3.81IQEE72 pKa = 4.36VKK74 pKa = 10.76LEE76 pKa = 4.07EE77 pKa = 4.44GNAGKK82 pKa = 10.4RR83 pKa = 11.84KK84 pKa = 7.9RR85 pKa = 11.84QRR87 pKa = 11.84RR88 pKa = 11.84RR89 pKa = 11.84RR90 pKa = 11.84KK91 pKa = 8.51KK92 pKa = 9.56KK93 pKa = 9.0AFKK96 pKa = 10.9RR97 pKa = 11.84MMTEE101 pKa = 3.5LEE103 pKa = 3.87DD104 pKa = 3.71RR105 pKa = 11.84FRR107 pKa = 11.84KK108 pKa = 10.15LFGTTSTTGDD118 pKa = 3.49STVDD122 pKa = 4.21SEE124 pKa = 5.45DD125 pKa = 3.73EE126 pKa = 4.08PPKK129 pKa = 10.29KK130 pKa = 9.89EE131 pKa = 4.93KK132 pKa = 10.59RR133 pKa = 11.84VDD135 pKa = 2.81WDD137 pKa = 3.95EE138 pKa = 3.78YY139 pKa = 9.66WNPEE143 pKa = 4.03EE144 pKa = 4.34IEE146 pKa = 4.24RR147 pKa = 11.84MLMDD151 pKa = 4.17
Molecular weight: 17.82 kDa
Isoelectric point according different methods:
Protein with the highest isoelectric point:
>tr|Q66014|Q66014_FIVPE Isoform of P16090 Env protein OS=Feline immunodeficiency virus (isolate Petaluma) OX=11674 GN=env PE=4 SV=1
MM1 pKa = 7.71LPRR4 pKa = 11.84NGDD7 pKa = 3.64FVPDD11 pKa = 4.64FIYY14 pKa = 10.72RR15 pKa = 11.84NNNIFTDD22 pKa = 3.86NQRR25 pKa = 11.84SGSMEE30 pKa = 3.88TSTISSPSRR39 pKa = 11.84RR40 pKa = 11.84IRR42 pKa = 11.84NNFLGLLGTRR52 pKa = 11.84RR53 pKa = 11.84TRR55 pKa = 11.84LSGLSWGNDD64 pKa = 3.14TSKK67 pKa = 11.14SS68 pKa = 3.55
MM1 pKa = 7.71LPRR4 pKa = 11.84NGDD7 pKa = 3.64FVPDD11 pKa = 4.64FIYY14 pKa = 10.72RR15 pKa = 11.84NNNIFTDD22 pKa = 3.86NQRR25 pKa = 11.84SGSMEE30 pKa = 3.88TSTISSPSRR39 pKa = 11.84RR40 pKa = 11.84IRR42 pKa = 11.84NNFLGLLGTRR52 pKa = 11.84RR53 pKa = 11.84TRR55 pKa = 11.84LSGLSWGNDD64 pKa = 3.14TSKK67 pKa = 11.14SS68 pKa = 3.55
Molecular weight: 7.72 kDa
Isoelectric point according different methods:
Peptides (in silico digests for buttom-up proteomics)
Below you can find in silico digests of the whole proteome with Trypsin, Chymotrypsin, Trypsin+LysC, LysN, ArgC proteases suitable for different mass spec machines.| Try ESI |
 |
|---|
| ChTry ESI |
 |
|---|
| ArgC ESI |
 |
|---|
| LysN ESI |
 |
|---|
| TryLysC ESI |
 |
|---|
| Try MALDI |
 |
|---|
| ChTry MALDI |
 |
|---|
| ArgC MALDI |
 |
|---|
| LysN MALDI |
 |
|---|
| TryLysC MALDI |
 |
|---|
| Try LTQ |
 |
|---|
| ChTry LTQ |
 |
|---|
| ArgC LTQ |
 |
|---|
| LysN LTQ |
 |
|---|
| TryLysC LTQ |
 |
|---|
| Try MSlow |
 |
|---|
| ChTry MSlow |
 |
|---|
| ArgC MSlow |
 |
|---|
| LysN MSlow |
 |
|---|
| TryLysC MSlow |
 |
|---|
| Try MShigh |
 |
|---|
| ChTry MShigh |
 |
|---|
| ArgC MShigh |
 |
|---|
| LysN MShigh |
 |
|---|
| TryLysC MShigh |
 |
|---|
General Statistics
Number of major isoforms |
Number of additional isoforms |
Number of all proteins |
Number of amino acids |
Min. Seq. Length |
Max. Seq. Length |
Avg. Seq. Length |
Avg. Mol. Weight |
|---|---|---|---|---|---|---|---|
2978 |
68 |
1124 |
425.4 |
48.43 |
Amino acid frequency
Ala |
Cys |
Asp |
Glu |
Phe |
Gly |
His |
Ile |
Lys |
Leu |
|---|---|---|---|---|---|---|---|---|---|
6.111 ± 1.103 | 2.418 ± 0.636 |
4.13 ± 0.422 | 7.455 ± 0.614 |
2.888 ± 0.502 | 7.421 ± 0.442 |
1.276 ± 0.246 | 7.018 ± 0.958 |
7.455 ± 0.699 | 8.731 ± 0.368 |
Met |
Asn |
Gln |
Pro |
Arg |
Ser |
Thr |
Val |
Trp |
Tyr |
|---|---|---|---|---|---|---|---|---|---|
2.989 ± 0.347 | 5.373 ± 0.637 |
5.037 ± 0.371 | 5.272 ± 0.463 |
5.541 ± 0.953 | 5.037 ± 0.459 |
4.835 ± 0.491 | 5.071 ± 0.334 |
2.686 ± 0.425 | 3.257 ± 0.355 |
Most of the basic statistics you can see at this page can be downloaded from this CSV file
Proteome-pI is available under Creative Commons Attribution-NoDerivs license, for more details see here
| Reference: Kozlowski LP. Proteome-pI 2.0: Proteome Isoelectric Point Database Update. Nucleic Acids Res. 2021, doi: 10.1093/nar/gkab944 | Contact: Lukasz P. Kozlowski |
