Capybara microvirus Cap1_SP_158
Taxonomy: Viruses; Monodnaviria; Sangervirae; Phixviricota; Malgrandaviricetes; Petitvirales; Microviridae; unclassified Microviridae
Average proteome isoelectric point is 5.94
Get precalculated fractions of proteins

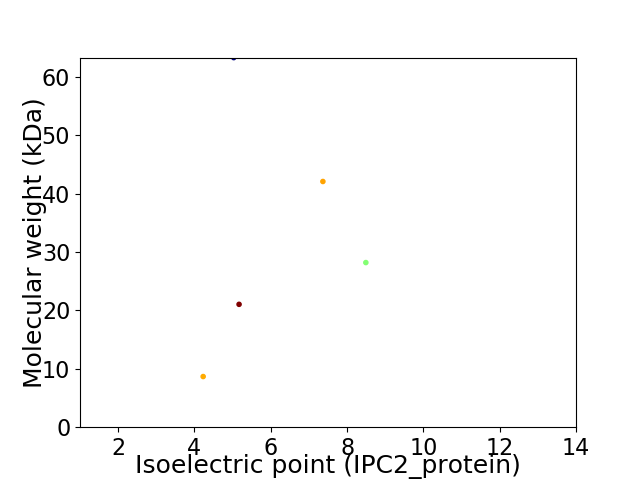
Virtual 2D-PAGE plot for 5 proteins (isoelectric point calculated using IPC2_protein)
Get csv file with sequences according to given criteria:
* You can choose from 21 different methods for calculating isoelectric point
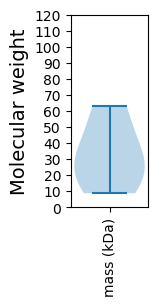
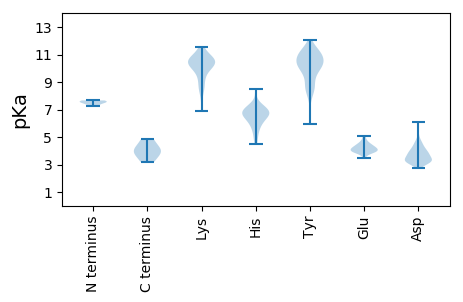
Summary statistics related to proteome-wise predictions


Protein with the lowest isoelectric point:
>tr|A0A4P8W7Y9|A0A4P8W7Y9_9VIRU Uncharacterized protein OS=Capybara microvirus Cap1_SP_158 OX=2585394 PE=4 SV=1
MM1 pKa = 7.48NKK3 pKa = 9.85NSMFQEE9 pKa = 4.72HH10 pKa = 7.16PSSFQLFMLGDD21 pKa = 3.17ICEE24 pKa = 4.54NMNAMCTEE32 pKa = 4.3FDD34 pKa = 4.47SVDD37 pKa = 3.61LLLPMDD43 pKa = 3.91EE44 pKa = 4.38TGEE47 pKa = 4.16RR48 pKa = 11.84CCIPLEE54 pKa = 4.13SLGTVGEE61 pKa = 4.65FYY63 pKa = 10.66RR64 pKa = 11.84KK65 pKa = 9.37EE66 pKa = 4.07SIVYY70 pKa = 9.99EE71 pKa = 4.24EE72 pKa = 4.09EE73 pKa = 4.1HH74 pKa = 6.52LL75 pKa = 4.2
MM1 pKa = 7.48NKK3 pKa = 9.85NSMFQEE9 pKa = 4.72HH10 pKa = 7.16PSSFQLFMLGDD21 pKa = 3.17ICEE24 pKa = 4.54NMNAMCTEE32 pKa = 4.3FDD34 pKa = 4.47SVDD37 pKa = 3.61LLLPMDD43 pKa = 3.91EE44 pKa = 4.38TGEE47 pKa = 4.16RR48 pKa = 11.84CCIPLEE54 pKa = 4.13SLGTVGEE61 pKa = 4.65FYY63 pKa = 10.66RR64 pKa = 11.84KK65 pKa = 9.37EE66 pKa = 4.07SIVYY70 pKa = 9.99EE71 pKa = 4.24EE72 pKa = 4.09EE73 pKa = 4.1HH74 pKa = 6.52LL75 pKa = 4.2
Molecular weight: 8.67 kDa
Isoelectric point according different methods:
Protein with the highest isoelectric point:
>tr|A0A4P8W473|A0A4P8W473_9VIRU Major capsid protein OS=Capybara microvirus Cap1_SP_158 OX=2585394 PE=3 SV=1
MM1 pKa = 7.66SSNNQAWYY9 pKa = 8.25TWSPPKK15 pKa = 8.91NTKK18 pKa = 8.59YY19 pKa = 8.29WHH21 pKa = 6.87GYY23 pKa = 8.71LPIGIAIRR31 pKa = 11.84DD32 pKa = 3.84NFNTANAIRR41 pKa = 11.84RR42 pKa = 11.84AANNFNTDD50 pKa = 3.12TTSDD54 pKa = 3.28TKK56 pKa = 10.64TLQKK60 pKa = 10.69SLQSLIKK67 pKa = 10.05GQTSAKK73 pKa = 6.89TTTNNNINNGYY84 pKa = 9.67VDD86 pKa = 4.01TGSSSLDD93 pKa = 3.22SSLQTLAEE101 pKa = 4.52HH102 pKa = 6.02NTNASIEE109 pKa = 4.17INRR112 pKa = 11.84MNNAFNASEE121 pKa = 4.0AQKK124 pKa = 10.87NRR126 pKa = 11.84DD127 pKa = 3.21WQEE130 pKa = 4.05SMSNTAHH137 pKa = 5.31QRR139 pKa = 11.84EE140 pKa = 4.37VEE142 pKa = 4.07DD143 pKa = 4.69LKK145 pKa = 11.41AAGLNPVLSAGGQGAATGSGSAASSSGNANVDD177 pKa = 3.63SAVNALASIQTAQISAAAMVSAAAIAAQASMYY209 pKa = 10.87GSDD212 pKa = 3.52NALSGTKK219 pKa = 10.33YY220 pKa = 9.86STDD223 pKa = 2.75LTYY226 pKa = 11.36YY227 pKa = 8.85KK228 pKa = 10.49TNSPWNLINRR238 pKa = 11.84LLPNSDD244 pKa = 3.17TSAKK248 pKa = 10.43DD249 pKa = 2.97ILRR252 pKa = 11.84SIIGKK257 pKa = 9.18NEE259 pKa = 3.78VIFRR263 pKa = 11.84RR264 pKa = 3.94
MM1 pKa = 7.66SSNNQAWYY9 pKa = 8.25TWSPPKK15 pKa = 8.91NTKK18 pKa = 8.59YY19 pKa = 8.29WHH21 pKa = 6.87GYY23 pKa = 8.71LPIGIAIRR31 pKa = 11.84DD32 pKa = 3.84NFNTANAIRR41 pKa = 11.84RR42 pKa = 11.84AANNFNTDD50 pKa = 3.12TTSDD54 pKa = 3.28TKK56 pKa = 10.64TLQKK60 pKa = 10.69SLQSLIKK67 pKa = 10.05GQTSAKK73 pKa = 6.89TTTNNNINNGYY84 pKa = 9.67VDD86 pKa = 4.01TGSSSLDD93 pKa = 3.22SSLQTLAEE101 pKa = 4.52HH102 pKa = 6.02NTNASIEE109 pKa = 4.17INRR112 pKa = 11.84MNNAFNASEE121 pKa = 4.0AQKK124 pKa = 10.87NRR126 pKa = 11.84DD127 pKa = 3.21WQEE130 pKa = 4.05SMSNTAHH137 pKa = 5.31QRR139 pKa = 11.84EE140 pKa = 4.37VEE142 pKa = 4.07DD143 pKa = 4.69LKK145 pKa = 11.41AAGLNPVLSAGGQGAATGSGSAASSSGNANVDD177 pKa = 3.63SAVNALASIQTAQISAAAMVSAAAIAAQASMYY209 pKa = 10.87GSDD212 pKa = 3.52NALSGTKK219 pKa = 10.33YY220 pKa = 9.86STDD223 pKa = 2.75LTYY226 pKa = 11.36YY227 pKa = 8.85KK228 pKa = 10.49TNSPWNLINRR238 pKa = 11.84LLPNSDD244 pKa = 3.17TSAKK248 pKa = 10.43DD249 pKa = 2.97ILRR252 pKa = 11.84SIIGKK257 pKa = 9.18NEE259 pKa = 3.78VIFRR263 pKa = 11.84RR264 pKa = 3.94
Molecular weight: 28.2 kDa
Isoelectric point according different methods:
Peptides (in silico digests for buttom-up proteomics)
Below you can find in silico digests of the whole proteome with Trypsin, Chymotrypsin, Trypsin+LysC, LysN, ArgC proteases suitable for different mass spec machines.| Try ESI |
 |
|---|
| ChTry ESI |
 |
|---|
| ArgC ESI |
 |
|---|
| LysN ESI |
 |
|---|
| TryLysC ESI |
 |
|---|
| Try MALDI |
 |
|---|
| ChTry MALDI |
 |
|---|
| ArgC MALDI |
 |
|---|
| LysN MALDI |
 |
|---|
| TryLysC MALDI |
 |
|---|
| Try LTQ |
 |
|---|
| ChTry LTQ |
 |
|---|
| ArgC LTQ |
 |
|---|
| LysN LTQ |
 |
|---|
| TryLysC LTQ |
 |
|---|
| Try MSlow |
 |
|---|
| ChTry MSlow |
 |
|---|
| ArgC MSlow |
 |
|---|
| LysN MSlow |
 |
|---|
| TryLysC MSlow |
 |
|---|
| Try MShigh |
 |
|---|
| ChTry MShigh |
 |
|---|
| ArgC MShigh |
 |
|---|
| LysN MShigh |
 |
|---|
| TryLysC MShigh |
 |
|---|
General Statistics
Number of major isoforms |
Number of additional isoforms |
Number of all proteins |
Number of amino acids |
Min. Seq. Length |
Max. Seq. Length |
Avg. Seq. Length |
Avg. Mol. Weight |
|---|---|---|---|---|---|---|---|
0 |
1439 |
75 |
563 |
287.8 |
32.66 |
Amino acid frequency
Ala |
Cys |
Asp |
Glu |
Phe |
Gly |
His |
Ile |
Lys |
Leu |
|---|---|---|---|---|---|---|---|---|---|
7.505 ± 1.592 | 1.737 ± 0.618 |
5.768 ± 0.478 | 6.185 ± 1.416 |
4.864 ± 0.955 | 5.559 ± 0.305 |
2.293 ± 0.574 | 5.142 ± 0.414 |
5.073 ± 1.182 | 7.714 ± 0.991 |
Met |
Asn |
Gln |
Pro |
Arg |
Ser |
Thr |
Val |
Trp |
Tyr |
|---|---|---|---|---|---|---|---|---|---|
2.015 ± 0.409 | 6.115 ± 1.493 |
4.1 ± 0.474 | 4.448 ± 0.325 |
4.656 ± 0.258 | 8.826 ± 1.13 |
6.115 ± 0.638 | 4.656 ± 0.715 |
1.251 ± 0.283 | 5.976 ± 0.989 |
Most of the basic statistics you can see at this page can be downloaded from this CSV file
Proteome-pI is available under Creative Commons Attribution-NoDerivs license, for more details see here
| Reference: Kozlowski LP. Proteome-pI 2.0: Proteome Isoelectric Point Database Update. Nucleic Acids Res. 2021, doi: 10.1093/nar/gkab944 | Contact: Lukasz P. Kozlowski |
