Enterococcus phage EFP01
Taxonomy: Viruses; Duplodnaviria; Heunggongvirae; Uroviricota; Caudoviricetes; Caudovirales; Herelleviridae; Brockvirinae; Schiekvirus; Enterococcus virus EFP01
Average proteome isoelectric point is 6.19
Get precalculated fractions of proteins

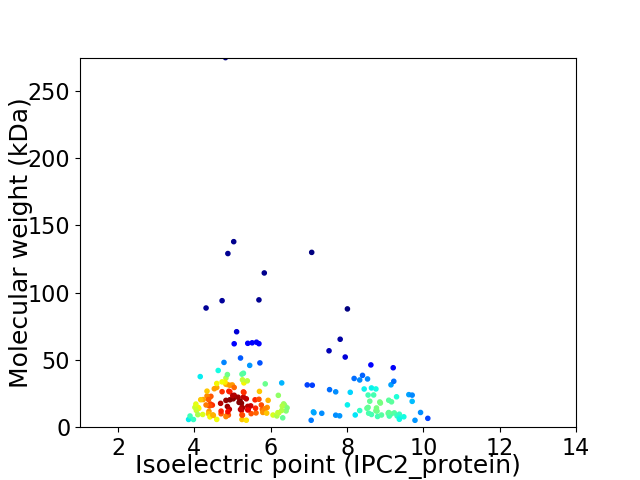
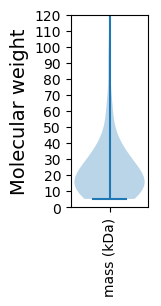
Virtual 2D-PAGE plot for 193 proteins (isoelectric point calculated using IPC2_protein)
Get csv file with sequences according to given criteria:
* You can choose from 21 different methods for calculating isoelectric point
Summary statistics related to proteome-wise predictions


Protein with the lowest isoelectric point:
>tr|A0A288TXP4|A0A288TXP4_9CAUD Uncharacterized protein OS=Enterococcus phage EFP01 OX=1926594 GN=EFP01_016 PE=4 SV=1
MM1 pKa = 7.35TNKK4 pKa = 10.03NSNIQLALANVTRR17 pKa = 11.84YY18 pKa = 10.69KK19 pKa = 11.32DD20 pKa = 3.37MNDD23 pKa = 2.92YY24 pKa = 10.19KK25 pKa = 10.55QAHH28 pKa = 5.54EE29 pKa = 4.4TPEE32 pKa = 3.7EE33 pKa = 3.94AQADD37 pKa = 4.31FNEE40 pKa = 4.9KK41 pKa = 10.06IADD44 pKa = 4.14GYY46 pKa = 9.27IQNITLSTYY55 pKa = 11.0NGATQKK61 pKa = 9.15NTFFEE66 pKa = 4.45LTDD69 pKa = 3.71EE70 pKa = 5.09NILEE74 pKa = 4.65AIYY77 pKa = 10.67TDD79 pKa = 3.39LHH81 pKa = 5.75EE82 pKa = 4.57TDD84 pKa = 4.12SYY86 pKa = 12.0SMIDD90 pKa = 3.6EE91 pKa = 4.5MEE93 pKa = 4.21EE94 pKa = 4.15STDD97 pKa = 3.56LTKK100 pKa = 10.09WDD102 pKa = 3.98YY103 pKa = 11.04IRR105 pKa = 11.84AYY107 pKa = 8.92TEE109 pKa = 3.59IYY111 pKa = 10.88NVFTLDD117 pKa = 3.12GLVYY121 pKa = 10.12IEE123 pKa = 5.02RR124 pKa = 11.84DD125 pKa = 3.15
MM1 pKa = 7.35TNKK4 pKa = 10.03NSNIQLALANVTRR17 pKa = 11.84YY18 pKa = 10.69KK19 pKa = 11.32DD20 pKa = 3.37MNDD23 pKa = 2.92YY24 pKa = 10.19KK25 pKa = 10.55QAHH28 pKa = 5.54EE29 pKa = 4.4TPEE32 pKa = 3.7EE33 pKa = 3.94AQADD37 pKa = 4.31FNEE40 pKa = 4.9KK41 pKa = 10.06IADD44 pKa = 4.14GYY46 pKa = 9.27IQNITLSTYY55 pKa = 11.0NGATQKK61 pKa = 9.15NTFFEE66 pKa = 4.45LTDD69 pKa = 3.71EE70 pKa = 5.09NILEE74 pKa = 4.65AIYY77 pKa = 10.67TDD79 pKa = 3.39LHH81 pKa = 5.75EE82 pKa = 4.57TDD84 pKa = 4.12SYY86 pKa = 12.0SMIDD90 pKa = 3.6EE91 pKa = 4.5MEE93 pKa = 4.21EE94 pKa = 4.15STDD97 pKa = 3.56LTKK100 pKa = 10.09WDD102 pKa = 3.98YY103 pKa = 11.04IRR105 pKa = 11.84AYY107 pKa = 8.92TEE109 pKa = 3.59IYY111 pKa = 10.88NVFTLDD117 pKa = 3.12GLVYY121 pKa = 10.12IEE123 pKa = 5.02RR124 pKa = 11.84DD125 pKa = 3.15
Molecular weight: 14.62 kDa
Isoelectric point according different methods:
Protein with the highest isoelectric point:
>tr|A0A288TY61|A0A288TY61_9CAUD Uncharacterized protein OS=Enterococcus phage EFP01 OX=1926594 GN=EFP01_081 PE=4 SV=1
MM1 pKa = 7.2TNKK4 pKa = 9.61AQHH7 pKa = 5.77IAKK10 pKa = 8.61MAKK13 pKa = 9.5EE14 pKa = 4.14MYY16 pKa = 8.84GTDD19 pKa = 4.32KK20 pKa = 10.34ITTAQLAYY28 pKa = 8.28ITDD31 pKa = 3.81MLTPSTYY38 pKa = 11.02LLRR41 pKa = 11.84NHH43 pKa = 6.35SVRR46 pKa = 11.84NHH48 pKa = 7.6PITFMISGRR57 pKa = 11.84DD58 pKa = 3.46QQKK61 pKa = 10.5AQAHH65 pKa = 6.1RR66 pKa = 11.84PWQVKK71 pKa = 9.89IINDD75 pKa = 3.31QHH77 pKa = 5.27RR78 pKa = 11.84TKK80 pKa = 10.97AVIKK84 pKa = 10.27SRR86 pKa = 11.84QLGLRR91 pKa = 11.84LAPLL95 pKa = 3.65
MM1 pKa = 7.2TNKK4 pKa = 9.61AQHH7 pKa = 5.77IAKK10 pKa = 8.61MAKK13 pKa = 9.5EE14 pKa = 4.14MYY16 pKa = 8.84GTDD19 pKa = 4.32KK20 pKa = 10.34ITTAQLAYY28 pKa = 8.28ITDD31 pKa = 3.81MLTPSTYY38 pKa = 11.02LLRR41 pKa = 11.84NHH43 pKa = 6.35SVRR46 pKa = 11.84NHH48 pKa = 7.6PITFMISGRR57 pKa = 11.84DD58 pKa = 3.46QQKK61 pKa = 10.5AQAHH65 pKa = 6.1RR66 pKa = 11.84PWQVKK71 pKa = 9.89IINDD75 pKa = 3.31QHH77 pKa = 5.27RR78 pKa = 11.84TKK80 pKa = 10.97AVIKK84 pKa = 10.27SRR86 pKa = 11.84QLGLRR91 pKa = 11.84LAPLL95 pKa = 3.65
Molecular weight: 10.94 kDa
Isoelectric point according different methods:
Peptides (in silico digests for buttom-up proteomics)
Below you can find in silico digests of the whole proteome with Trypsin, Chymotrypsin, Trypsin+LysC, LysN, ArgC proteases suitable for different mass spec machines.| Try ESI |
 |
|---|
| ChTry ESI |
 |
|---|
| ArgC ESI |
 |
|---|
| LysN ESI |
 |
|---|
| TryLysC ESI |
 |
|---|
| Try MALDI |
 |
|---|
| ChTry MALDI |
 |
|---|
| ArgC MALDI |
 |
|---|
| LysN MALDI |
 |
|---|
| TryLysC MALDI |
 |
|---|
| Try LTQ |
 |
|---|
| ChTry LTQ |
 |
|---|
| ArgC LTQ |
 |
|---|
| LysN LTQ |
 |
|---|
| TryLysC LTQ |
 |
|---|
| Try MSlow |
 |
|---|
| ChTry MSlow |
 |
|---|
| ArgC MSlow |
 |
|---|
| LysN MSlow |
 |
|---|
| TryLysC MSlow |
 |
|---|
| Try MShigh |
 |
|---|
| ChTry MShigh |
 |
|---|
| ArgC MShigh |
 |
|---|
| LysN MShigh |
 |
|---|
| TryLysC MShigh |
 |
|---|
General Statistics
Number of major isoforms |
Number of additional isoforms |
Number of all proteins |
Number of amino acids |
Min. Seq. Length |
Max. Seq. Length |
Avg. Seq. Length |
Avg. Mol. Weight |
|---|---|---|---|---|---|---|---|
0 |
44767 |
42 |
2488 |
232.0 |
26.35 |
Amino acid frequency
Ala |
Cys |
Asp |
Glu |
Phe |
Gly |
His |
Ile |
Lys |
Leu |
|---|---|---|---|---|---|---|---|---|---|
6.112 ± 0.226 | 0.918 ± 0.092 |
6.199 ± 0.129 | 7.99 ± 0.305 |
3.804 ± 0.115 | 6.248 ± 0.202 |
1.651 ± 0.107 | 6.214 ± 0.119 |
7.925 ± 0.211 | 8.312 ± 0.192 |
Met |
Asn |
Gln |
Pro |
Arg |
Ser |
Thr |
Val |
Trp |
Tyr |
|---|---|---|---|---|---|---|---|---|---|
2.473 ± 0.075 | 5.504 ± 0.163 |
3.221 ± 0.138 | 3.824 ± 0.159 |
4.398 ± 0.144 | 5.92 ± 0.158 |
6.679 ± 0.263 | 6.882 ± 0.168 |
1.092 ± 0.069 | 4.633 ± 0.162 |
Most of the basic statistics you can see at this page can be downloaded from this CSV file
Proteome-pI is available under Creative Commons Attribution-NoDerivs license, for more details see here
| Reference: Kozlowski LP. Proteome-pI 2.0: Proteome Isoelectric Point Database Update. Nucleic Acids Res. 2021, doi: 10.1093/nar/gkab944 | Contact: Lukasz P. Kozlowski |
