Streptomyces sp. CB03234
Taxonomy: cellular organisms; Bacteria; Terrabacteria group; Actinobacteria; Actinomycetia; Streptomycetales; Streptomycetaceae; Streptomyces; unclassified Streptomyces
Average proteome isoelectric point is 6.4
Get precalculated fractions of proteins

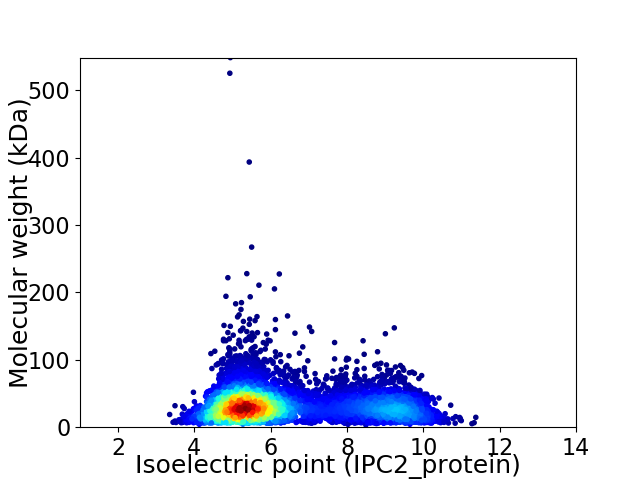
Virtual 2D-PAGE plot for 6567 proteins (isoelectric point calculated using IPC2_protein)
Get csv file with sequences according to given criteria:
* You can choose from 21 different methods for calculating isoelectric point
Summary statistics related to proteome-wise predictions


Protein with the lowest isoelectric point:
>tr|A0A1Q5LNN2|A0A1Q5LNN2_9ACTN Transferase OS=Streptomyces sp. CB03234 OX=1703937 GN=AMK26_19100 PE=4 SV=1
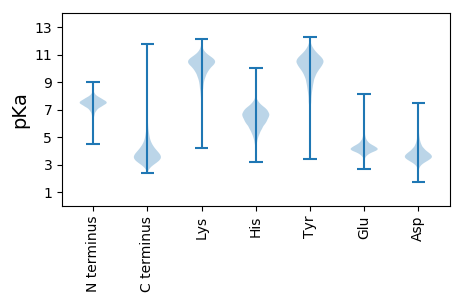
MM1 pKa = 7.39LTTDD5 pKa = 4.79FVPGTPNWIDD15 pKa = 3.52LGAPDD20 pKa = 4.14TDD22 pKa = 3.55AAVAFYY28 pKa = 10.79SAVFGWTFQSAGPEE42 pKa = 3.61AGGYY46 pKa = 10.83GFFQRR51 pKa = 11.84DD52 pKa = 3.64GGTVAALGPLTEE64 pKa = 5.09EE65 pKa = 4.68GASPAWTPYY74 pKa = 10.04FHH76 pKa = 6.89TPDD79 pKa = 3.66ADD81 pKa = 3.64ATSKK85 pKa = 10.87AVEE88 pKa = 4.07QAGGTVRR95 pKa = 11.84VPPMDD100 pKa = 3.31VFTAGRR106 pKa = 11.84MAAFTDD112 pKa = 3.54PTGADD117 pKa = 3.34FAVWQPGDD125 pKa = 3.67TKK127 pKa = 11.41GLDD130 pKa = 3.19TVMEE134 pKa = 4.95PNTLCWTEE142 pKa = 5.19LYY144 pKa = 7.71TTDD147 pKa = 3.84AAAAKK152 pKa = 10.05DD153 pKa = 4.53FYY155 pKa = 11.22RR156 pKa = 11.84SVCSWQYY163 pKa = 11.29QDD165 pKa = 3.6MDD167 pKa = 3.46MGGGMVYY174 pKa = 10.33SVVSSPGGGTDD185 pKa = 4.43DD186 pKa = 5.93DD187 pKa = 4.88PGQGGIMQLQEE198 pKa = 3.97EE199 pKa = 4.37NLAAGSGSEE208 pKa = 3.49WHH210 pKa = 7.16PYY212 pKa = 10.08FGVTDD217 pKa = 4.28CDD219 pKa = 3.43ATFATATEE227 pKa = 4.5HH228 pKa = 6.84GATPLVAPIDD238 pKa = 3.91APGVGRR244 pKa = 11.84LAMLMDD250 pKa = 4.76PSGAPFALIKK260 pKa = 10.68GDD262 pKa = 3.61PTTTT266 pKa = 3.23
MM1 pKa = 7.39LTTDD5 pKa = 4.79FVPGTPNWIDD15 pKa = 3.52LGAPDD20 pKa = 4.14TDD22 pKa = 3.55AAVAFYY28 pKa = 10.79SAVFGWTFQSAGPEE42 pKa = 3.61AGGYY46 pKa = 10.83GFFQRR51 pKa = 11.84DD52 pKa = 3.64GGTVAALGPLTEE64 pKa = 5.09EE65 pKa = 4.68GASPAWTPYY74 pKa = 10.04FHH76 pKa = 6.89TPDD79 pKa = 3.66ADD81 pKa = 3.64ATSKK85 pKa = 10.87AVEE88 pKa = 4.07QAGGTVRR95 pKa = 11.84VPPMDD100 pKa = 3.31VFTAGRR106 pKa = 11.84MAAFTDD112 pKa = 3.54PTGADD117 pKa = 3.34FAVWQPGDD125 pKa = 3.67TKK127 pKa = 11.41GLDD130 pKa = 3.19TVMEE134 pKa = 4.95PNTLCWTEE142 pKa = 5.19LYY144 pKa = 7.71TTDD147 pKa = 3.84AAAAKK152 pKa = 10.05DD153 pKa = 4.53FYY155 pKa = 11.22RR156 pKa = 11.84SVCSWQYY163 pKa = 11.29QDD165 pKa = 3.6MDD167 pKa = 3.46MGGGMVYY174 pKa = 10.33SVVSSPGGGTDD185 pKa = 4.43DD186 pKa = 5.93DD187 pKa = 4.88PGQGGIMQLQEE198 pKa = 3.97EE199 pKa = 4.37NLAAGSGSEE208 pKa = 3.49WHH210 pKa = 7.16PYY212 pKa = 10.08FGVTDD217 pKa = 4.28CDD219 pKa = 3.43ATFATATEE227 pKa = 4.5HH228 pKa = 6.84GATPLVAPIDD238 pKa = 3.91APGVGRR244 pKa = 11.84LAMLMDD250 pKa = 4.76PSGAPFALIKK260 pKa = 10.68GDD262 pKa = 3.61PTTTT266 pKa = 3.23
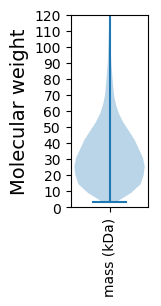
Molecular weight: 27.71 kDa
Isoelectric point according different methods:
Protein with the highest isoelectric point:
>tr|A0A1Q5LHT0|A0A1Q5LHT0_9ACTN Short-chain dehydrogenase OS=Streptomyces sp. CB03234 OX=1703937 GN=AMK26_26600 PE=4 SV=1
MM1 pKa = 7.45ARR3 pKa = 11.84GAGAGLPRR11 pKa = 11.84GRR13 pKa = 11.84GHH15 pKa = 6.93RR16 pKa = 11.84AAVAGRR22 pKa = 11.84RR23 pKa = 11.84HH24 pKa = 5.98RR25 pKa = 11.84FARR28 pKa = 11.84ALSRR32 pKa = 11.84AAITASVTGFRR43 pKa = 11.84RR44 pKa = 11.84AGPVTARR51 pKa = 11.84VTASHH56 pKa = 7.73RR57 pKa = 11.84IPAHH61 pKa = 5.92RR62 pKa = 11.84APP64 pKa = 4.3
MM1 pKa = 7.45ARR3 pKa = 11.84GAGAGLPRR11 pKa = 11.84GRR13 pKa = 11.84GHH15 pKa = 6.93RR16 pKa = 11.84AAVAGRR22 pKa = 11.84RR23 pKa = 11.84HH24 pKa = 5.98RR25 pKa = 11.84FARR28 pKa = 11.84ALSRR32 pKa = 11.84AAITASVTGFRR43 pKa = 11.84RR44 pKa = 11.84AGPVTARR51 pKa = 11.84VTASHH56 pKa = 7.73RR57 pKa = 11.84IPAHH61 pKa = 5.92RR62 pKa = 11.84APP64 pKa = 4.3
Molecular weight: 6.68 kDa
Isoelectric point according different methods:
Peptides (in silico digests for buttom-up proteomics)
Below you can find in silico digests of the whole proteome with Trypsin, Chymotrypsin, Trypsin+LysC, LysN, ArgC proteases suitable for different mass spec machines.| Try ESI |
 |
|---|
| ChTry ESI |
 |
|---|
| ArgC ESI |
 |
|---|
| LysN ESI |
 |
|---|
| TryLysC ESI |
 |
|---|
| Try MALDI |
 |
|---|
| ChTry MALDI |
 |
|---|
| ArgC MALDI |
 |
|---|
| LysN MALDI |
 |
|---|
| TryLysC MALDI |
 |
|---|
| Try LTQ |
 |
|---|
| ChTry LTQ |
 |
|---|
| ArgC LTQ |
 |
|---|
| LysN LTQ |
 |
|---|
| TryLysC LTQ |
 |
|---|
| Try MSlow |
 |
|---|
| ChTry MSlow |
 |
|---|
| ArgC MSlow |
 |
|---|
| LysN MSlow |
 |
|---|
| TryLysC MSlow |
 |
|---|
| Try MShigh |
 |
|---|
| ChTry MShigh |
 |
|---|
| ArgC MShigh |
 |
|---|
| LysN MShigh |
 |
|---|
| TryLysC MShigh |
 |
|---|
General Statistics
Number of major isoforms |
Number of additional isoforms |
Number of all proteins |
Number of amino acids |
Min. Seq. Length |
Max. Seq. Length |
Avg. Seq. Length |
Avg. Mol. Weight |
|---|---|---|---|---|---|---|---|
2133522 |
34 |
5168 |
324.9 |
34.79 |
Amino acid frequency
Ala |
Cys |
Asp |
Glu |
Phe |
Gly |
His |
Ile |
Lys |
Leu |
|---|---|---|---|---|---|---|---|---|---|
13.787 ± 0.048 | 0.805 ± 0.01 |
5.941 ± 0.025 | 5.768 ± 0.031 |
2.703 ± 0.017 | 9.49 ± 0.03 |
2.319 ± 0.013 | 3.164 ± 0.024 |
2.222 ± 0.022 | 10.341 ± 0.042 |
Met |
Asn |
Gln |
Pro |
Arg |
Ser |
Thr |
Val |
Trp |
Tyr |
|---|---|---|---|---|---|---|---|---|---|
1.77 ± 0.013 | 1.724 ± 0.015 |
6.167 ± 0.029 | 2.671 ± 0.018 |
8.114 ± 0.033 | 4.741 ± 0.02 |
6.127 ± 0.027 | 8.507 ± 0.029 |
1.511 ± 0.013 | 2.128 ± 0.015 |
Most of the basic statistics you can see at this page can be downloaded from this CSV file
Proteome-pI is available under Creative Commons Attribution-NoDerivs license, for more details see here
| Reference: Kozlowski LP. Proteome-pI 2.0: Proteome Isoelectric Point Database Update. Nucleic Acids Res. 2021, doi: 10.1093/nar/gkab944 | Contact: Lukasz P. Kozlowski |
