Colombian potato soil-borne virus
Taxonomy: Viruses; Riboviria; Orthornavirae; Kitrinoviricota; Alsuviricetes; Martellivirales; Virgaviridae; Pomovirus
Average proteome isoelectric point is 5.97
Get precalculated fractions of proteins

Virtual 2D-PAGE plot for 7 proteins (isoelectric point calculated using IPC2_protein)
Get csv file with sequences according to given criteria:
* You can choose from 21 different methods for calculating isoelectric point
Summary statistics related to proteome-wise predictions


Protein with the lowest isoelectric point:
>tr|A0A0U3CCW0|A0A0U3CCW0_9VIRU Putative coat protein OS=Colombian potato soil-borne virus OX=1758139 GN=CP-RT PE=4 SV=1
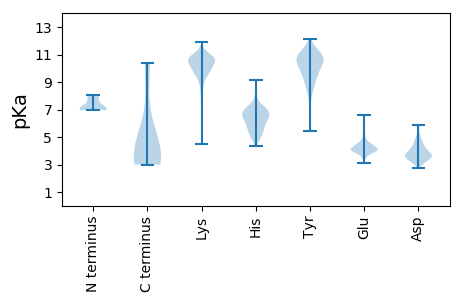
MM1 pKa = 8.05DD2 pKa = 5.53PPVIIHH8 pKa = 6.5SPNCSCQYY16 pKa = 10.23CSSEE20 pKa = 4.19LPSTHH25 pKa = 6.3TCGSQDD31 pKa = 4.7PIAQSHH37 pKa = 6.53AGGIAARR44 pKa = 11.84ITGANSEE51 pKa = 4.5YY52 pKa = 10.67FSLSYY57 pKa = 10.88VLLVAVVSVLLGFSACVYY75 pKa = 9.59IKK77 pKa = 10.56SVSNEE82 pKa = 3.81DD83 pKa = 3.85PADD86 pKa = 3.38MTYY89 pKa = 10.84YY90 pKa = 10.6YY91 pKa = 10.77QDD93 pKa = 3.82LNSVEE98 pKa = 4.15IKK100 pKa = 10.47LGKK103 pKa = 10.1NPLDD107 pKa = 3.71PEE109 pKa = 4.51VIKK112 pKa = 10.69AIHH115 pKa = 6.28SFQEE119 pKa = 4.18YY120 pKa = 8.77PFGYY124 pKa = 9.8VPSIRR129 pKa = 11.84GGPEE133 pKa = 3.46HH134 pKa = 6.74EE135 pKa = 4.48VSNEE139 pKa = 3.4GSGAVALTDD148 pKa = 3.43SRR150 pKa = 11.84NVRR153 pKa = 11.84QVDD156 pKa = 3.93DD157 pKa = 4.37SPCAHH162 pKa = 6.39STLTSLWKK170 pKa = 10.25DD171 pKa = 3.37DD172 pKa = 4.21LSFTIIAVTVLALGVVFAPRR192 pKa = 3.2
MM1 pKa = 8.05DD2 pKa = 5.53PPVIIHH8 pKa = 6.5SPNCSCQYY16 pKa = 10.23CSSEE20 pKa = 4.19LPSTHH25 pKa = 6.3TCGSQDD31 pKa = 4.7PIAQSHH37 pKa = 6.53AGGIAARR44 pKa = 11.84ITGANSEE51 pKa = 4.5YY52 pKa = 10.67FSLSYY57 pKa = 10.88VLLVAVVSVLLGFSACVYY75 pKa = 9.59IKK77 pKa = 10.56SVSNEE82 pKa = 3.81DD83 pKa = 3.85PADD86 pKa = 3.38MTYY89 pKa = 10.84YY90 pKa = 10.6YY91 pKa = 10.77QDD93 pKa = 3.82LNSVEE98 pKa = 4.15IKK100 pKa = 10.47LGKK103 pKa = 10.1NPLDD107 pKa = 3.71PEE109 pKa = 4.51VIKK112 pKa = 10.69AIHH115 pKa = 6.28SFQEE119 pKa = 4.18YY120 pKa = 8.77PFGYY124 pKa = 9.8VPSIRR129 pKa = 11.84GGPEE133 pKa = 3.46HH134 pKa = 6.74EE135 pKa = 4.48VSNEE139 pKa = 3.4GSGAVALTDD148 pKa = 3.43SRR150 pKa = 11.84NVRR153 pKa = 11.84QVDD156 pKa = 3.93DD157 pKa = 4.37SPCAHH162 pKa = 6.39STLTSLWKK170 pKa = 10.25DD171 pKa = 3.37DD172 pKa = 4.21LSFTIIAVTVLALGVVFAPRR192 pKa = 3.2
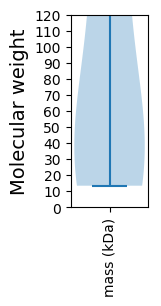
Molecular weight: 20.63 kDa
Isoelectric point according different methods:
Protein with the highest isoelectric point:
>tr|A0A0U3ALY5|A0A0U3ALY5_9VIRU Methyltransferase/RNA helicase OS=Colombian potato soil-borne virus OX=1758139 GN=ORF2 PE=4 SV=1
MM1 pKa = 6.98VRR3 pKa = 11.84SNEE6 pKa = 3.43IGARR10 pKa = 11.84PNKK13 pKa = 8.92YY14 pKa = 8.3WPVVAAVVAICLFGFLTLTNQKK36 pKa = 10.04HH37 pKa = 4.89ATQSGDD43 pKa = 3.78NIHH46 pKa = 6.78KK47 pKa = 9.54FANGGQYY54 pKa = 10.13RR55 pKa = 11.84DD56 pKa = 3.35GSKK59 pKa = 10.37SIKK62 pKa = 9.99YY63 pKa = 9.27NCNNPRR69 pKa = 11.84AYY71 pKa = 10.55NGSSSNNTFSQLFLPVLLLGAALYY95 pKa = 10.43AYY97 pKa = 10.64LWFTRR102 pKa = 11.84PDD104 pKa = 3.34CSVTCRR110 pKa = 11.84GDD112 pKa = 3.17CCKK115 pKa = 10.85NYY117 pKa = 10.53GGQQQ121 pKa = 3.0
MM1 pKa = 6.98VRR3 pKa = 11.84SNEE6 pKa = 3.43IGARR10 pKa = 11.84PNKK13 pKa = 8.92YY14 pKa = 8.3WPVVAAVVAICLFGFLTLTNQKK36 pKa = 10.04HH37 pKa = 4.89ATQSGDD43 pKa = 3.78NIHH46 pKa = 6.78KK47 pKa = 9.54FANGGQYY54 pKa = 10.13RR55 pKa = 11.84DD56 pKa = 3.35GSKK59 pKa = 10.37SIKK62 pKa = 9.99YY63 pKa = 9.27NCNNPRR69 pKa = 11.84AYY71 pKa = 10.55NGSSSNNTFSQLFLPVLLLGAALYY95 pKa = 10.43AYY97 pKa = 10.64LWFTRR102 pKa = 11.84PDD104 pKa = 3.34CSVTCRR110 pKa = 11.84GDD112 pKa = 3.17CCKK115 pKa = 10.85NYY117 pKa = 10.53GGQQQ121 pKa = 3.0
Molecular weight: 13.37 kDa
Isoelectric point according different methods:
Peptides (in silico digests for buttom-up proteomics)
Below you can find in silico digests of the whole proteome with Trypsin, Chymotrypsin, Trypsin+LysC, LysN, ArgC proteases suitable for different mass spec machines.| Try ESI |
 |
|---|
| ChTry ESI |
 |
|---|
| ArgC ESI |
 |
|---|
| LysN ESI |
 |
|---|
| TryLysC ESI |
 |
|---|
| Try MALDI |
 |
|---|
| ChTry MALDI |
 |
|---|
| ArgC MALDI |
 |
|---|
| LysN MALDI |
 |
|---|
| TryLysC MALDI |
 |
|---|
| Try LTQ |
 |
|---|
| ChTry LTQ |
 |
|---|
| ArgC LTQ |
 |
|---|
| LysN LTQ |
 |
|---|
| TryLysC LTQ |
 |
|---|
| Try MSlow |
 |
|---|
| ChTry MSlow |
 |
|---|
| ArgC MSlow |
 |
|---|
| LysN MSlow |
 |
|---|
| TryLysC MSlow |
 |
|---|
| Try MShigh |
 |
|---|
| ChTry MShigh |
 |
|---|
| ArgC MShigh |
 |
|---|
| LysN MShigh |
 |
|---|
| TryLysC MShigh |
 |
|---|
General Statistics
Number of major isoforms |
Number of additional isoforms |
Number of all proteins |
Number of amino acids |
Min. Seq. Length |
Max. Seq. Length |
Avg. Seq. Length |
Avg. Mol. Weight |
|---|---|---|---|---|---|---|---|
5012 |
121 |
1850 |
716.0 |
80.22 |
Amino acid frequency
Ala |
Cys |
Asp |
Glu |
Phe |
Gly |
His |
Ile |
Lys |
Leu |
|---|---|---|---|---|---|---|---|---|---|
7.003 ± 0.585 | 1.816 ± 0.164 |
6.584 ± 0.504 | 7.482 ± 0.409 |
4.01 ± 0.214 | 6.524 ± 0.46 |
1.856 ± 0.164 | 4.569 ± 0.131 |
6.265 ± 0.737 | 9.058 ± 0.296 |
Met |
Asn |
Gln |
Pro |
Arg |
Ser |
Thr |
Val |
Trp |
Tyr |
|---|---|---|---|---|---|---|---|---|---|
2.255 ± 0.388 | 4.27 ± 0.339 |
3.571 ± 0.291 | 3.272 ± 0.299 |
6.006 ± 0.36 | 7.941 ± 0.628 |
5.188 ± 0.159 | 7.841 ± 0.45 |
1.057 ± 0.104 | 3.392 ± 0.295 |
Most of the basic statistics you can see at this page can be downloaded from this CSV file
Proteome-pI is available under Creative Commons Attribution-NoDerivs license, for more details see here
| Reference: Kozlowski LP. Proteome-pI 2.0: Proteome Isoelectric Point Database Update. Nucleic Acids Res. 2021, doi: 10.1093/nar/gkab944 | Contact: Lukasz P. Kozlowski |
