Bacillus selenitireducens (strain ATCC 700615 / DSM 15326 / MLS10)
Taxonomy: cellular organisms; Bacteria; Terrabacteria group; Firmicutes; Bacilli; Bacillales; Sporolactobacillaceae; Sporolactobacillaceae incertae sedis; [Bacillus] selenitireducens
Average proteome isoelectric point is 5.82
Get precalculated fractions of proteins

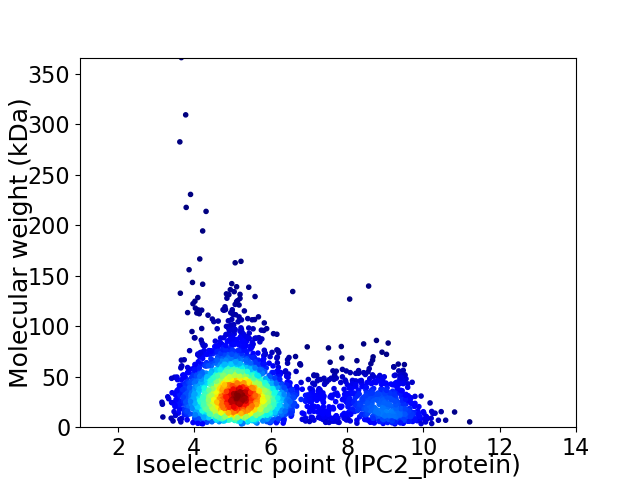
Virtual 2D-PAGE plot for 3231 proteins (isoelectric point calculated using IPC2_protein)
Get csv file with sequences according to given criteria:
* You can choose from 21 different methods for calculating isoelectric point
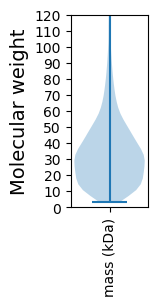
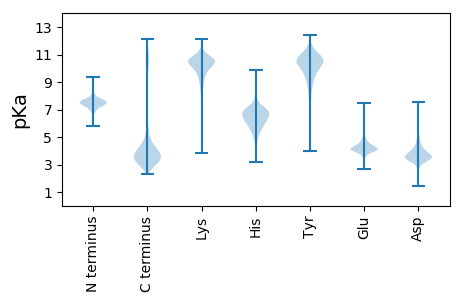
Summary statistics related to proteome-wise predictions


Protein with the lowest isoelectric point:
>tr|D6XXS5|D6XXS5_BACIE Acriflavin resistance protein OS=Bacillus selenitireducens (strain ATCC 700615 / DSM 15326 / MLS10) OX=439292 GN=Bsel_2618 PE=4 SV=1
MM1 pKa = 7.44TIKK4 pKa = 10.6HH5 pKa = 6.46LLTASMALFLTACSADD21 pKa = 2.94SSTDD25 pKa = 3.33VEE27 pKa = 4.21ATEE30 pKa = 4.3DD31 pKa = 3.59QEE33 pKa = 5.42LEE35 pKa = 4.35DD36 pKa = 4.13VSIMLDD42 pKa = 3.71WYY44 pKa = 9.56PNAVHH49 pKa = 6.7SYY51 pKa = 10.1LYY53 pKa = 10.0TAMEE57 pKa = 3.45QGYY60 pKa = 9.03FEE62 pKa = 4.59EE63 pKa = 4.85EE64 pKa = 4.46GIEE67 pKa = 3.88LSIRR71 pKa = 11.84FPANPTDD78 pKa = 4.28PLSLAATGDD87 pKa = 3.24ITIGITYY94 pKa = 9.85QPDD97 pKa = 3.63VITARR102 pKa = 11.84NQGIPVVSIAAIARR116 pKa = 11.84SPLNHH121 pKa = 7.25IIYY124 pKa = 9.81TDD126 pKa = 3.74DD127 pKa = 5.21AIEE130 pKa = 4.5SPADD134 pKa = 3.5LAGKK138 pKa = 8.93QVGYY142 pKa = 9.83PGIPVNEE149 pKa = 3.99PMIDD153 pKa = 3.07TMVRR157 pKa = 11.84HH158 pKa = 6.43AGGDD162 pKa = 3.62PNEE165 pKa = 4.25VEE167 pKa = 4.76LIDD170 pKa = 3.86VGFEE174 pKa = 4.13LGSSAVSGRR183 pKa = 11.84VDD185 pKa = 3.4AVSGAYY191 pKa = 9.2INHH194 pKa = 6.16EE195 pKa = 4.39VPVLRR200 pKa = 11.84YY201 pKa = 9.27QGHH204 pKa = 5.11EE205 pKa = 3.55VHH207 pKa = 6.15YY208 pKa = 9.02FNPVDD213 pKa = 3.55YY214 pKa = 10.14GVPPFYY220 pKa = 10.49EE221 pKa = 4.03LVMVTSEE228 pKa = 3.98EE229 pKa = 4.25TLDD232 pKa = 3.57EE233 pKa = 4.31NQPLIEE239 pKa = 4.45AFWRR243 pKa = 11.84AASRR247 pKa = 11.84GFDD250 pKa = 4.79DD251 pKa = 4.41MQADD255 pKa = 4.03PDD257 pKa = 3.96GSLDD261 pKa = 3.66VLFTHH266 pKa = 7.25EE267 pKa = 4.25DD268 pKa = 3.37QEE270 pKa = 4.35NFPLIRR276 pKa = 11.84EE277 pKa = 4.23VEE279 pKa = 4.15EE280 pKa = 3.98EE281 pKa = 4.07SLGILLEE288 pKa = 4.34KK289 pKa = 8.78MTLDD293 pKa = 3.5GATFGSQYY301 pKa = 11.17ADD303 pKa = 3.38DD304 pKa = 4.03WQATIDD310 pKa = 3.48WLYY313 pKa = 10.02EE314 pKa = 3.87SGFIEE319 pKa = 4.5EE320 pKa = 5.1KK321 pKa = 10.51PDD323 pKa = 3.71TEE325 pKa = 4.66DD326 pKa = 3.47SFINLVEE333 pKa = 4.25DD334 pKa = 3.73
MM1 pKa = 7.44TIKK4 pKa = 10.6HH5 pKa = 6.46LLTASMALFLTACSADD21 pKa = 2.94SSTDD25 pKa = 3.33VEE27 pKa = 4.21ATEE30 pKa = 4.3DD31 pKa = 3.59QEE33 pKa = 5.42LEE35 pKa = 4.35DD36 pKa = 4.13VSIMLDD42 pKa = 3.71WYY44 pKa = 9.56PNAVHH49 pKa = 6.7SYY51 pKa = 10.1LYY53 pKa = 10.0TAMEE57 pKa = 3.45QGYY60 pKa = 9.03FEE62 pKa = 4.59EE63 pKa = 4.85EE64 pKa = 4.46GIEE67 pKa = 3.88LSIRR71 pKa = 11.84FPANPTDD78 pKa = 4.28PLSLAATGDD87 pKa = 3.24ITIGITYY94 pKa = 9.85QPDD97 pKa = 3.63VITARR102 pKa = 11.84NQGIPVVSIAAIARR116 pKa = 11.84SPLNHH121 pKa = 7.25IIYY124 pKa = 9.81TDD126 pKa = 3.74DD127 pKa = 5.21AIEE130 pKa = 4.5SPADD134 pKa = 3.5LAGKK138 pKa = 8.93QVGYY142 pKa = 9.83PGIPVNEE149 pKa = 3.99PMIDD153 pKa = 3.07TMVRR157 pKa = 11.84HH158 pKa = 6.43AGGDD162 pKa = 3.62PNEE165 pKa = 4.25VEE167 pKa = 4.76LIDD170 pKa = 3.86VGFEE174 pKa = 4.13LGSSAVSGRR183 pKa = 11.84VDD185 pKa = 3.4AVSGAYY191 pKa = 9.2INHH194 pKa = 6.16EE195 pKa = 4.39VPVLRR200 pKa = 11.84YY201 pKa = 9.27QGHH204 pKa = 5.11EE205 pKa = 3.55VHH207 pKa = 6.15YY208 pKa = 9.02FNPVDD213 pKa = 3.55YY214 pKa = 10.14GVPPFYY220 pKa = 10.49EE221 pKa = 4.03LVMVTSEE228 pKa = 3.98EE229 pKa = 4.25TLDD232 pKa = 3.57EE233 pKa = 4.31NQPLIEE239 pKa = 4.45AFWRR243 pKa = 11.84AASRR247 pKa = 11.84GFDD250 pKa = 4.79DD251 pKa = 4.41MQADD255 pKa = 4.03PDD257 pKa = 3.96GSLDD261 pKa = 3.66VLFTHH266 pKa = 7.25EE267 pKa = 4.25DD268 pKa = 3.37QEE270 pKa = 4.35NFPLIRR276 pKa = 11.84EE277 pKa = 4.23VEE279 pKa = 4.15EE280 pKa = 3.98EE281 pKa = 4.07SLGILLEE288 pKa = 4.34KK289 pKa = 8.78MTLDD293 pKa = 3.5GATFGSQYY301 pKa = 11.17ADD303 pKa = 3.38DD304 pKa = 4.03WQATIDD310 pKa = 3.48WLYY313 pKa = 10.02EE314 pKa = 3.87SGFIEE319 pKa = 4.5EE320 pKa = 5.1KK321 pKa = 10.51PDD323 pKa = 3.71TEE325 pKa = 4.66DD326 pKa = 3.47SFINLVEE333 pKa = 4.25DD334 pKa = 3.73
Molecular weight: 36.91 kDa
Isoelectric point according different methods:
Protein with the highest isoelectric point:
>tr|D6XSG8|D6XSG8_BACIE Pseudouridine synthase OS=Bacillus selenitireducens (strain ATCC 700615 / DSM 15326 / MLS10) OX=439292 GN=Bsel_1242 PE=3 SV=1
MM1 pKa = 7.69GKK3 pKa = 7.98PTFNPNNRR11 pKa = 11.84KK12 pKa = 9.18RR13 pKa = 11.84KK14 pKa = 8.17KK15 pKa = 9.24VHH17 pKa = 5.91GFRR20 pKa = 11.84QRR22 pKa = 11.84MSTSNGRR29 pKa = 11.84RR30 pKa = 11.84VLASRR35 pKa = 11.84RR36 pKa = 11.84RR37 pKa = 11.84KK38 pKa = 8.73GRR40 pKa = 11.84KK41 pKa = 8.76VLSAA45 pKa = 4.05
MM1 pKa = 7.69GKK3 pKa = 7.98PTFNPNNRR11 pKa = 11.84KK12 pKa = 9.18RR13 pKa = 11.84KK14 pKa = 8.17KK15 pKa = 9.24VHH17 pKa = 5.91GFRR20 pKa = 11.84QRR22 pKa = 11.84MSTSNGRR29 pKa = 11.84RR30 pKa = 11.84VLASRR35 pKa = 11.84RR36 pKa = 11.84RR37 pKa = 11.84KK38 pKa = 8.73GRR40 pKa = 11.84KK41 pKa = 8.76VLSAA45 pKa = 4.05
Molecular weight: 5.27 kDa
Isoelectric point according different methods:
Peptides (in silico digests for buttom-up proteomics)
Below you can find in silico digests of the whole proteome with Trypsin, Chymotrypsin, Trypsin+LysC, LysN, ArgC proteases suitable for different mass spec machines.| Try ESI |
 |
|---|
| ChTry ESI |
 |
|---|
| ArgC ESI |
 |
|---|
| LysN ESI |
 |
|---|
| TryLysC ESI |
 |
|---|
| Try MALDI |
 |
|---|
| ChTry MALDI |
 |
|---|
| ArgC MALDI |
 |
|---|
| LysN MALDI |
 |
|---|
| TryLysC MALDI |
 |
|---|
| Try LTQ |
 |
|---|
| ChTry LTQ |
 |
|---|
| ArgC LTQ |
 |
|---|
| LysN LTQ |
 |
|---|
| TryLysC LTQ |
 |
|---|
| Try MSlow |
 |
|---|
| ChTry MSlow |
 |
|---|
| ArgC MSlow |
 |
|---|
| LysN MSlow |
 |
|---|
| TryLysC MSlow |
 |
|---|
| Try MShigh |
 |
|---|
| ChTry MShigh |
 |
|---|
| ArgC MShigh |
 |
|---|
| LysN MShigh |
 |
|---|
| TryLysC MShigh |
 |
|---|
General Statistics
Number of major isoforms |
Number of additional isoforms |
Number of all proteins |
Number of amino acids |
Min. Seq. Length |
Max. Seq. Length |
Avg. Seq. Length |
Avg. Mol. Weight |
|---|---|---|---|---|---|---|---|
0 |
1028036 |
30 |
3273 |
318.2 |
35.58 |
Amino acid frequency
Ala |
Cys |
Asp |
Glu |
Phe |
Gly |
His |
Ile |
Lys |
Leu |
|---|---|---|---|---|---|---|---|---|---|
7.742 ± 0.048 | 0.599 ± 0.013 |
6.231 ± 0.043 | 7.946 ± 0.063 |
4.344 ± 0.036 | 7.257 ± 0.041 |
2.31 ± 0.023 | 6.745 ± 0.046 |
5.175 ± 0.039 | 9.328 ± 0.049 |
Met |
Asn |
Gln |
Pro |
Arg |
Ser |
Thr |
Val |
Trp |
Tyr |
|---|---|---|---|---|---|---|---|---|---|
3.135 ± 0.022 | 3.661 ± 0.026 |
3.772 ± 0.025 | 3.71 ± 0.025 |
4.973 ± 0.034 | 5.901 ± 0.031 |
5.672 ± 0.033 | 7.255 ± 0.035 |
1.033 ± 0.015 | 3.212 ± 0.024 |
Most of the basic statistics you can see at this page can be downloaded from this CSV file
Proteome-pI is available under Creative Commons Attribution-NoDerivs license, for more details see here
| Reference: Kozlowski LP. Proteome-pI 2.0: Proteome Isoelectric Point Database Update. Nucleic Acids Res. 2021, doi: 10.1093/nar/gkab944 | Contact: Lukasz P. Kozlowski |
