Aeropyrum pernix bacilliform virus 1 (isolate -/Japan/Tanaka/2005) (APBV1)
Taxonomy: Viruses; Clavaviridae; Clavavirus; Aeropyrum pernix bacilliform virus 1
Average proteome isoelectric point is 6.57
Get precalculated fractions of proteins

Virtual 2D-PAGE plot for 14 proteins (isoelectric point calculated using IPC2_protein)
Get csv file with sequences according to given criteria:
* You can choose from 21 different methods for calculating isoelectric point
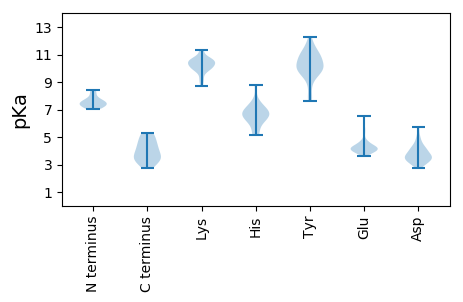
Summary statistics related to proteome-wise predictions


Protein with the lowest isoelectric point:
>tr|D4QF74|D4QF74_APBV1 Minor virion protein OS=Aeropyrum pernix bacilliform virus 1 (isolate -/Japan/Tanaka/2005) OX=1289471 PE=4 SV=1
MM1 pKa = 7.25NLKK4 pKa = 10.03AWAISIGVGVGLLVILPTLAGLLDD28 pKa = 3.66MAVNSIPAPSTINWSKK44 pKa = 11.31VGTIDD49 pKa = 4.07PNNNTSIQVSTTTPMLIKK67 pKa = 10.78LEE69 pKa = 4.11VTEE72 pKa = 4.33WNLVIVMKK80 pKa = 10.19QYY82 pKa = 11.43KK83 pKa = 8.92DD84 pKa = 2.79TDD86 pKa = 3.58GAIRR90 pKa = 11.84ASHH93 pKa = 6.74EE94 pKa = 4.4YY95 pKa = 9.96IDD97 pKa = 5.12DD98 pKa = 4.21PNGYY102 pKa = 7.69VTGWNWDD109 pKa = 3.64PNEE112 pKa = 3.98GVIMTSPKK120 pKa = 10.01IGFDD124 pKa = 3.26TTEE127 pKa = 3.96GSGQVEE133 pKa = 4.81WYY135 pKa = 9.45YY136 pKa = 11.4GAGALEE142 pKa = 4.39YY143 pKa = 11.1NLTTLPASVDD153 pKa = 3.44VYY155 pKa = 10.59IAEE158 pKa = 4.68GVDD161 pKa = 3.45KK162 pKa = 9.98YY163 pKa = 11.79DD164 pKa = 3.86PMAEE168 pKa = 4.15SGLGDD173 pKa = 4.03LGILARR179 pKa = 11.84VVAVFGLLAALAVAFHH195 pKa = 6.62KK196 pKa = 11.15VGGGLL201 pKa = 3.44
MM1 pKa = 7.25NLKK4 pKa = 10.03AWAISIGVGVGLLVILPTLAGLLDD28 pKa = 3.66MAVNSIPAPSTINWSKK44 pKa = 11.31VGTIDD49 pKa = 4.07PNNNTSIQVSTTTPMLIKK67 pKa = 10.78LEE69 pKa = 4.11VTEE72 pKa = 4.33WNLVIVMKK80 pKa = 10.19QYY82 pKa = 11.43KK83 pKa = 8.92DD84 pKa = 2.79TDD86 pKa = 3.58GAIRR90 pKa = 11.84ASHH93 pKa = 6.74EE94 pKa = 4.4YY95 pKa = 9.96IDD97 pKa = 5.12DD98 pKa = 4.21PNGYY102 pKa = 7.69VTGWNWDD109 pKa = 3.64PNEE112 pKa = 3.98GVIMTSPKK120 pKa = 10.01IGFDD124 pKa = 3.26TTEE127 pKa = 3.96GSGQVEE133 pKa = 4.81WYY135 pKa = 9.45YY136 pKa = 11.4GAGALEE142 pKa = 4.39YY143 pKa = 11.1NLTTLPASVDD153 pKa = 3.44VYY155 pKa = 10.59IAEE158 pKa = 4.68GVDD161 pKa = 3.45KK162 pKa = 9.98YY163 pKa = 11.79DD164 pKa = 3.86PMAEE168 pKa = 4.15SGLGDD173 pKa = 4.03LGILARR179 pKa = 11.84VVAVFGLLAALAVAFHH195 pKa = 6.62KK196 pKa = 11.15VGGGLL201 pKa = 3.44
Molecular weight: 21.39 kDa
Isoelectric point according different methods:
Protein with the highest isoelectric point:
>tr|D4QF78|D4QF78_APBV1 Uncharacterized protein OS=Aeropyrum pernix bacilliform virus 1 (isolate -/Japan/Tanaka/2005) OX=1289471 PE=4 SV=1
MM1 pKa = 8.16RR2 pKa = 11.84YY3 pKa = 9.7NLLLEE8 pKa = 4.43LARR11 pKa = 11.84LKK13 pKa = 10.44PQLYY17 pKa = 10.49LMAIAPGRR25 pKa = 11.84PPWEE29 pKa = 4.18TVIKK33 pKa = 10.12AYY35 pKa = 10.79SEE37 pKa = 3.96ARR39 pKa = 11.84GLEE42 pKa = 3.99RR43 pKa = 11.84EE44 pKa = 4.29VARR47 pKa = 11.84ITLQTSYY54 pKa = 10.96RR55 pKa = 11.84SLKK58 pKa = 9.68GRR60 pKa = 11.84VVTKK64 pKa = 10.27RR65 pKa = 11.84RR66 pKa = 11.84SLGKK70 pKa = 10.36VVLTPAGSWRR80 pKa = 11.84LYY82 pKa = 10.06LIEE85 pKa = 4.44VGRR88 pKa = 11.84FDD90 pKa = 4.09
MM1 pKa = 8.16RR2 pKa = 11.84YY3 pKa = 9.7NLLLEE8 pKa = 4.43LARR11 pKa = 11.84LKK13 pKa = 10.44PQLYY17 pKa = 10.49LMAIAPGRR25 pKa = 11.84PPWEE29 pKa = 4.18TVIKK33 pKa = 10.12AYY35 pKa = 10.79SEE37 pKa = 3.96ARR39 pKa = 11.84GLEE42 pKa = 3.99RR43 pKa = 11.84EE44 pKa = 4.29VARR47 pKa = 11.84ITLQTSYY54 pKa = 10.96RR55 pKa = 11.84SLKK58 pKa = 9.68GRR60 pKa = 11.84VVTKK64 pKa = 10.27RR65 pKa = 11.84RR66 pKa = 11.84SLGKK70 pKa = 10.36VVLTPAGSWRR80 pKa = 11.84LYY82 pKa = 10.06LIEE85 pKa = 4.44VGRR88 pKa = 11.84FDD90 pKa = 4.09
Molecular weight: 10.39 kDa
Isoelectric point according different methods:
Peptides (in silico digests for buttom-up proteomics)
Below you can find in silico digests of the whole proteome with Trypsin, Chymotrypsin, Trypsin+LysC, LysN, ArgC proteases suitable for different mass spec machines.| Try ESI |
 |
|---|
| ChTry ESI |
 |
|---|
| ArgC ESI |
 |
|---|
| LysN ESI |
 |
|---|
| TryLysC ESI |
 |
|---|
| Try MALDI |
 |
|---|
| ChTry MALDI |
 |
|---|
| ArgC MALDI |
 |
|---|
| LysN MALDI |
 |
|---|
| TryLysC MALDI |
 |
|---|
| Try LTQ |
 |
|---|
| ChTry LTQ |
 |
|---|
| ArgC LTQ |
 |
|---|
| LysN LTQ |
 |
|---|
| TryLysC LTQ |
 |
|---|
| Try MSlow |
 |
|---|
| ChTry MSlow |
 |
|---|
| ArgC MSlow |
 |
|---|
| LysN MSlow |
 |
|---|
| TryLysC MSlow |
 |
|---|
| Try MShigh |
 |
|---|
| ChTry MShigh |
 |
|---|
| ArgC MShigh |
 |
|---|
| LysN MShigh |
 |
|---|
| TryLysC MShigh |
 |
|---|
General Statistics
Number of major isoforms |
Number of additional isoforms |
Number of all proteins |
Number of amino acids |
Min. Seq. Length |
Max. Seq. Length |
Avg. Seq. Length |
Avg. Mol. Weight |
|---|---|---|---|---|---|---|---|
0 |
1553 |
50 |
201 |
110.9 |
12.39 |
Amino acid frequency
Ala |
Cys |
Asp |
Glu |
Phe |
Gly |
His |
Ile |
Lys |
Leu |
|---|---|---|---|---|---|---|---|---|---|
7.92 ± 0.942 | 0.901 ± 0.413 |
4.765 ± 0.588 | 6.053 ± 1.114 |
3.67 ± 0.622 | 7.791 ± 0.882 |
1.417 ± 0.382 | 6.761 ± 0.503 |
4.765 ± 0.666 | 12.041 ± 0.642 |
Met |
Asn |
Gln |
Pro |
Arg |
Ser |
Thr |
Val |
Trp |
Tyr |
|---|---|---|---|---|---|---|---|---|---|
2.511 ± 0.347 | 3.284 ± 0.479 |
4.765 ± 0.488 | 2.447 ± 0.316 |
6.053 ± 1.023 | 5.087 ± 0.297 |
5.023 ± 0.662 | 9.015 ± 0.851 |
1.867 ± 0.328 | 3.863 ± 0.496 |
Most of the basic statistics you can see at this page can be downloaded from this CSV file
Proteome-pI is available under Creative Commons Attribution-NoDerivs license, for more details see here
| Reference: Kozlowski LP. Proteome-pI 2.0: Proteome Isoelectric Point Database Update. Nucleic Acids Res. 2021, doi: 10.1093/nar/gkab944 | Contact: Lukasz P. Kozlowski |
