bacterium C-53
Taxonomy: cellular organisms; Bacteria; unclassified Bacteria
Average proteome isoelectric point is 6.14
Get precalculated fractions of proteins

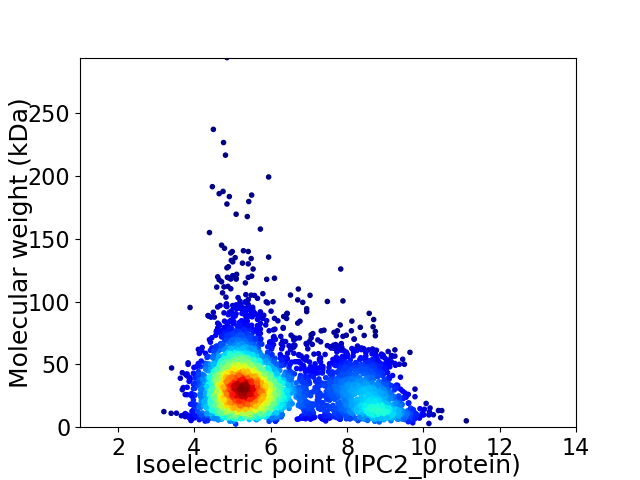
Virtual 2D-PAGE plot for 3732 proteins (isoelectric point calculated using IPC2_protein)
Get csv file with sequences according to given criteria:
* You can choose from 21 different methods for calculating isoelectric point
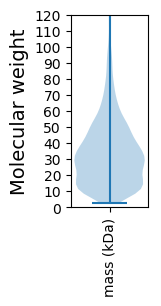
Summary statistics related to proteome-wise predictions


Protein with the lowest isoelectric point:
>tr|A0A3A9C100|A0A3A9C100_9BACT LysM peptidoglycan-binding domain-containing protein OS=bacterium C-53 OX=2320109 GN=D7X88_11095 PE=4 SV=1
MM1 pKa = 7.36SMSVSKK7 pKa = 10.85KK8 pKa = 10.57DD9 pKa = 3.61LLLLLGLCGVLAAALVYY26 pKa = 9.05FFVYY30 pKa = 10.1QPFMQKK36 pKa = 9.81SDD38 pKa = 3.53ALEE41 pKa = 4.25TEE43 pKa = 4.33NNSLSVRR50 pKa = 11.84IAEE53 pKa = 4.25LEE55 pKa = 3.79AMEE58 pKa = 4.84AKK60 pKa = 10.11RR61 pKa = 11.84EE62 pKa = 3.97EE63 pKa = 4.89YY64 pKa = 9.11ITEE67 pKa = 4.1TEE69 pKa = 4.09DD70 pKa = 3.04MNRR73 pKa = 11.84QIASVYY79 pKa = 10.82NLFPSNVMAEE89 pKa = 4.09DD90 pKa = 4.89AIYY93 pKa = 10.21LAIYY97 pKa = 9.62EE98 pKa = 4.32EE99 pKa = 4.66SLAPLQVNGITIEE112 pKa = 4.07PQEE115 pKa = 3.95VQYY118 pKa = 11.34QSGGNEE124 pKa = 3.88DD125 pKa = 3.88TEE127 pKa = 4.38GTEE130 pKa = 4.21EE131 pKa = 5.35KK132 pKa = 10.62EE133 pKa = 4.53DD134 pKa = 4.87AIDD137 pKa = 3.8KK138 pKa = 10.62AKK140 pKa = 10.86SDD142 pKa = 3.81APADD146 pKa = 3.89QAALEE151 pKa = 4.43ADD153 pKa = 3.67AEE155 pKa = 4.48LEE157 pKa = 4.23GTAVDD162 pKa = 4.94SDD164 pKa = 4.44ADD166 pKa = 3.77DD167 pKa = 3.76EE168 pKa = 4.35AAEE171 pKa = 5.21DD172 pKa = 4.65RR173 pKa = 11.84ITDD176 pKa = 3.62AGANMALYY184 pKa = 8.06NQPVTISYY192 pKa = 9.07EE193 pKa = 3.76LSYY196 pKa = 11.37DD197 pKa = 3.58GLKK200 pKa = 10.41RR201 pKa = 11.84CINYY205 pKa = 9.38ICTNPNRR212 pKa = 11.84MTVEE216 pKa = 4.38SVAAAYY222 pKa = 10.04DD223 pKa = 3.71NTSGMLSGNMRR234 pKa = 11.84VNMYY238 pKa = 10.69YY239 pKa = 9.45LTGNGKK245 pKa = 9.6PYY247 pKa = 10.06TPPDD251 pKa = 3.86FSNVLIGNTNLFGSIVLPEE270 pKa = 4.12TQSDD274 pKa = 3.69SGEE277 pKa = 4.09DD278 pKa = 3.48AEE280 pKa = 5.67EE281 pKa = 4.25EE282 pKa = 3.97NTDD285 pKa = 4.49ANEE288 pKa = 3.87QMM290 pKa = 4.49
MM1 pKa = 7.36SMSVSKK7 pKa = 10.85KK8 pKa = 10.57DD9 pKa = 3.61LLLLLGLCGVLAAALVYY26 pKa = 9.05FFVYY30 pKa = 10.1QPFMQKK36 pKa = 9.81SDD38 pKa = 3.53ALEE41 pKa = 4.25TEE43 pKa = 4.33NNSLSVRR50 pKa = 11.84IAEE53 pKa = 4.25LEE55 pKa = 3.79AMEE58 pKa = 4.84AKK60 pKa = 10.11RR61 pKa = 11.84EE62 pKa = 3.97EE63 pKa = 4.89YY64 pKa = 9.11ITEE67 pKa = 4.1TEE69 pKa = 4.09DD70 pKa = 3.04MNRR73 pKa = 11.84QIASVYY79 pKa = 10.82NLFPSNVMAEE89 pKa = 4.09DD90 pKa = 4.89AIYY93 pKa = 10.21LAIYY97 pKa = 9.62EE98 pKa = 4.32EE99 pKa = 4.66SLAPLQVNGITIEE112 pKa = 4.07PQEE115 pKa = 3.95VQYY118 pKa = 11.34QSGGNEE124 pKa = 3.88DD125 pKa = 3.88TEE127 pKa = 4.38GTEE130 pKa = 4.21EE131 pKa = 5.35KK132 pKa = 10.62EE133 pKa = 4.53DD134 pKa = 4.87AIDD137 pKa = 3.8KK138 pKa = 10.62AKK140 pKa = 10.86SDD142 pKa = 3.81APADD146 pKa = 3.89QAALEE151 pKa = 4.43ADD153 pKa = 3.67AEE155 pKa = 4.48LEE157 pKa = 4.23GTAVDD162 pKa = 4.94SDD164 pKa = 4.44ADD166 pKa = 3.77DD167 pKa = 3.76EE168 pKa = 4.35AAEE171 pKa = 5.21DD172 pKa = 4.65RR173 pKa = 11.84ITDD176 pKa = 3.62AGANMALYY184 pKa = 8.06NQPVTISYY192 pKa = 9.07EE193 pKa = 3.76LSYY196 pKa = 11.37DD197 pKa = 3.58GLKK200 pKa = 10.41RR201 pKa = 11.84CINYY205 pKa = 9.38ICTNPNRR212 pKa = 11.84MTVEE216 pKa = 4.38SVAAAYY222 pKa = 10.04DD223 pKa = 3.71NTSGMLSGNMRR234 pKa = 11.84VNMYY238 pKa = 10.69YY239 pKa = 9.45LTGNGKK245 pKa = 9.6PYY247 pKa = 10.06TPPDD251 pKa = 3.86FSNVLIGNTNLFGSIVLPEE270 pKa = 4.12TQSDD274 pKa = 3.69SGEE277 pKa = 4.09DD278 pKa = 3.48AEE280 pKa = 5.67EE281 pKa = 4.25EE282 pKa = 3.97NTDD285 pKa = 4.49ANEE288 pKa = 3.87QMM290 pKa = 4.49
Molecular weight: 31.75 kDa
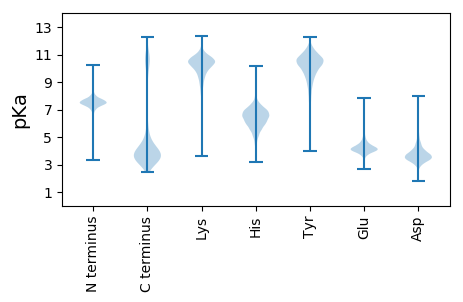
Isoelectric point according different methods:
Protein with the highest isoelectric point:
>tr|A0A3A9CHT8|A0A3A9CHT8_9BACT ROK family protein OS=bacterium C-53 OX=2320109 GN=D7X88_04840 PE=4 SV=1
MM1 pKa = 7.67KK2 pKa = 8.72MTFQPKK8 pKa = 8.95KK9 pKa = 7.58RR10 pKa = 11.84QRR12 pKa = 11.84SKK14 pKa = 9.17VHH16 pKa = 5.89GFRR19 pKa = 11.84ARR21 pKa = 11.84MSTPGGRR28 pKa = 11.84KK29 pKa = 8.77VLASRR34 pKa = 11.84RR35 pKa = 11.84AKK37 pKa = 10.13GRR39 pKa = 11.84KK40 pKa = 8.85KK41 pKa = 10.63LSAA44 pKa = 3.95
MM1 pKa = 7.67KK2 pKa = 8.72MTFQPKK8 pKa = 8.95KK9 pKa = 7.58RR10 pKa = 11.84QRR12 pKa = 11.84SKK14 pKa = 9.17VHH16 pKa = 5.89GFRR19 pKa = 11.84ARR21 pKa = 11.84MSTPGGRR28 pKa = 11.84KK29 pKa = 8.77VLASRR34 pKa = 11.84RR35 pKa = 11.84AKK37 pKa = 10.13GRR39 pKa = 11.84KK40 pKa = 8.85KK41 pKa = 10.63LSAA44 pKa = 3.95
Molecular weight: 5.06 kDa
Isoelectric point according different methods:
Peptides (in silico digests for buttom-up proteomics)
Below you can find in silico digests of the whole proteome with Trypsin, Chymotrypsin, Trypsin+LysC, LysN, ArgC proteases suitable for different mass spec machines.| Try ESI |
 |
|---|
| ChTry ESI |
 |
|---|
| ArgC ESI |
 |
|---|
| LysN ESI |
 |
|---|
| TryLysC ESI |
 |
|---|
| Try MALDI |
 |
|---|
| ChTry MALDI |
 |
|---|
| ArgC MALDI |
 |
|---|
| LysN MALDI |
 |
|---|
| TryLysC MALDI |
 |
|---|
| Try LTQ |
 |
|---|
| ChTry LTQ |
 |
|---|
| ArgC LTQ |
 |
|---|
| LysN LTQ |
 |
|---|
| TryLysC LTQ |
 |
|---|
| Try MSlow |
 |
|---|
| ChTry MSlow |
 |
|---|
| ArgC MSlow |
 |
|---|
| LysN MSlow |
 |
|---|
| TryLysC MSlow |
 |
|---|
| Try MShigh |
 |
|---|
| ChTry MShigh |
 |
|---|
| ArgC MShigh |
 |
|---|
| LysN MShigh |
 |
|---|
| TryLysC MShigh |
 |
|---|
General Statistics
Number of major isoforms |
Number of additional isoforms |
Number of all proteins |
Number of amino acids |
Min. Seq. Length |
Max. Seq. Length |
Avg. Seq. Length |
Avg. Mol. Weight |
|---|---|---|---|---|---|---|---|
0 |
1175357 |
22 |
2617 |
314.9 |
35.51 |
Amino acid frequency
Ala |
Cys |
Asp |
Glu |
Phe |
Gly |
His |
Ile |
Lys |
Leu |
|---|---|---|---|---|---|---|---|---|---|
7.27 ± 0.043 | 1.531 ± 0.015 |
5.592 ± 0.032 | 7.895 ± 0.041 |
4.311 ± 0.03 | 6.9 ± 0.039 |
1.742 ± 0.014 | 7.512 ± 0.043 |
6.787 ± 0.036 | 8.855 ± 0.043 |
Met |
Asn |
Gln |
Pro |
Arg |
Ser |
Thr |
Val |
Trp |
Tyr |
|---|---|---|---|---|---|---|---|---|---|
3.152 ± 0.02 | 4.406 ± 0.028 |
3.133 ± 0.023 | 3.187 ± 0.023 |
4.814 ± 0.03 | 5.878 ± 0.029 |
5.124 ± 0.033 | 6.739 ± 0.034 |
0.884 ± 0.013 | 4.287 ± 0.028 |
Most of the basic statistics you can see at this page can be downloaded from this CSV file
Proteome-pI is available under Creative Commons Attribution-NoDerivs license, for more details see here
| Reference: Kozlowski LP. Proteome-pI 2.0: Proteome Isoelectric Point Database Update. Nucleic Acids Res. 2021, doi: 10.1093/nar/gkab944 | Contact: Lukasz P. Kozlowski |
