Aspergillus steynii IBT 23096
Taxonomy: cellular organisms; Eukaryota; Opisthokonta; Fungi; Dikarya; Ascomycota; saccharomyceta; Pezizomycotina; leotiomyceta; Eurotiomycetes; Eurotiomycetidae; Eurotiales; Aspergillaceae; Aspergillus; Aspergillus subgen. Circumdati; Aspergillus steynii
Average proteome isoelectric point is 6.45
Get precalculated fractions of proteins

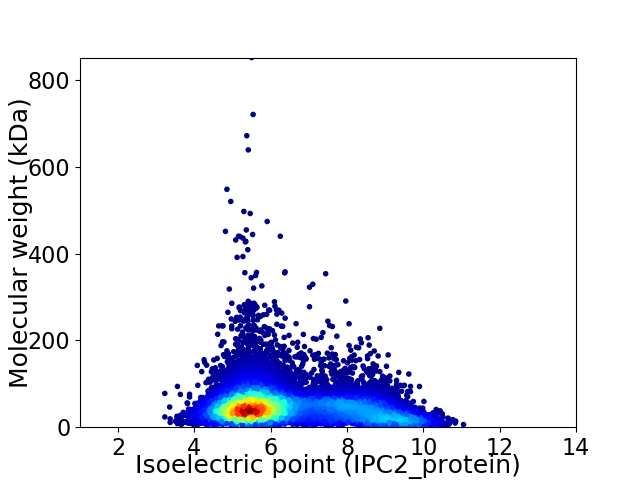
Virtual 2D-PAGE plot for 12965 proteins (isoelectric point calculated using IPC2_protein)
Get csv file with sequences according to given criteria:
* You can choose from 21 different methods for calculating isoelectric point
Summary statistics related to proteome-wise predictions


Protein with the lowest isoelectric point:
>tr|A0A2I2G879|A0A2I2G879_9EURO Uncharacterized protein (Fragment) OS=Aspergillus steynii IBT 23096 OX=1392250 GN=P170DRAFT_358376 PE=4 SV=1
MM1 pKa = 7.49SPAPLTTLLAAAASAPLLFSTGVSAQNATSRR32 pKa = 11.84AQIAMDD38 pKa = 5.0VLQTWYY44 pKa = 10.83NGTSGIWDD52 pKa = 3.47TCGWWNGANCLTTLADD68 pKa = 3.69FAIADD73 pKa = 3.93EE74 pKa = 4.58SVNDD78 pKa = 3.77AVVGVLGTTFKK89 pKa = 11.02VATISNPIPEE99 pKa = 4.2RR100 pKa = 11.84SGDD103 pKa = 3.41EE104 pKa = 4.43FYY106 pKa = 11.22NITDD110 pKa = 3.85GTQAGSPDD118 pKa = 3.47AYY120 pKa = 10.67QWMDD124 pKa = 2.75GSYY127 pKa = 11.38DD128 pKa = 3.82DD129 pKa = 4.97DD130 pKa = 4.1AWWALAWIAAYY141 pKa = 10.15DD142 pKa = 3.71VTDD145 pKa = 4.22DD146 pKa = 6.04DD147 pKa = 5.22EE148 pKa = 5.06YY149 pKa = 11.86LDD151 pKa = 3.94LAIGIFDD158 pKa = 4.27RR159 pKa = 11.84LSHH162 pKa = 6.03TWPSKK167 pKa = 10.13CGNGGIDD174 pKa = 3.06SDD176 pKa = 4.34YY177 pKa = 10.98SHH179 pKa = 7.52VYY181 pKa = 9.65VNAVTNEE188 pKa = 3.93LFFSVAAHH196 pKa = 6.54LANRR200 pKa = 11.84ASDD203 pKa = 3.39SQYY206 pKa = 9.88YY207 pKa = 9.52VDD209 pKa = 3.33WARR212 pKa = 11.84RR213 pKa = 11.84QWNWFNATGMINEE226 pKa = 4.69NYY228 pKa = 8.39TVNDD232 pKa = 4.04GLTNDD237 pKa = 4.41CANNGDD243 pKa = 4.43TIWTYY248 pKa = 10.49NQGVVIGGLAEE259 pKa = 3.95LHH261 pKa = 6.2RR262 pKa = 11.84SVSNSSNSSYY272 pKa = 11.4LDD274 pKa = 3.35MAEE277 pKa = 4.88KK278 pKa = 9.89IAKK281 pKa = 10.16ASIDD285 pKa = 3.6EE286 pKa = 4.5LADD289 pKa = 3.71DD290 pKa = 4.35NYY292 pKa = 10.75VIRR295 pKa = 11.84EE296 pKa = 4.17SCEE299 pKa = 3.7PDD301 pKa = 3.11CDD303 pKa = 4.57ANATQFKK310 pKa = 10.81GIFIRR315 pKa = 11.84NLKK318 pKa = 9.37LLHH321 pKa = 6.55SVAPDD326 pKa = 3.36DD327 pKa = 4.43VYY329 pKa = 11.64EE330 pKa = 4.13KK331 pKa = 10.77VIRR334 pKa = 11.84ACADD338 pKa = 3.88SIWDD342 pKa = 3.69NDD344 pKa = 3.76RR345 pKa = 11.84DD346 pKa = 3.8EE347 pKa = 4.49QNQFGINWAGPVSAIDD363 pKa = 3.74ASTHH367 pKa = 5.38SSAMDD372 pKa = 3.88ALVAAIDD379 pKa = 3.73EE380 pKa = 4.57DD381 pKa = 4.01
MM1 pKa = 7.49SPAPLTTLLAAAASAPLLFSTGVSAQNATSRR32 pKa = 11.84AQIAMDD38 pKa = 5.0VLQTWYY44 pKa = 10.83NGTSGIWDD52 pKa = 3.47TCGWWNGANCLTTLADD68 pKa = 3.69FAIADD73 pKa = 3.93EE74 pKa = 4.58SVNDD78 pKa = 3.77AVVGVLGTTFKK89 pKa = 11.02VATISNPIPEE99 pKa = 4.2RR100 pKa = 11.84SGDD103 pKa = 3.41EE104 pKa = 4.43FYY106 pKa = 11.22NITDD110 pKa = 3.85GTQAGSPDD118 pKa = 3.47AYY120 pKa = 10.67QWMDD124 pKa = 2.75GSYY127 pKa = 11.38DD128 pKa = 3.82DD129 pKa = 4.97DD130 pKa = 4.1AWWALAWIAAYY141 pKa = 10.15DD142 pKa = 3.71VTDD145 pKa = 4.22DD146 pKa = 6.04DD147 pKa = 5.22EE148 pKa = 5.06YY149 pKa = 11.86LDD151 pKa = 3.94LAIGIFDD158 pKa = 4.27RR159 pKa = 11.84LSHH162 pKa = 6.03TWPSKK167 pKa = 10.13CGNGGIDD174 pKa = 3.06SDD176 pKa = 4.34YY177 pKa = 10.98SHH179 pKa = 7.52VYY181 pKa = 9.65VNAVTNEE188 pKa = 3.93LFFSVAAHH196 pKa = 6.54LANRR200 pKa = 11.84ASDD203 pKa = 3.39SQYY206 pKa = 9.88YY207 pKa = 9.52VDD209 pKa = 3.33WARR212 pKa = 11.84RR213 pKa = 11.84QWNWFNATGMINEE226 pKa = 4.69NYY228 pKa = 8.39TVNDD232 pKa = 4.04GLTNDD237 pKa = 4.41CANNGDD243 pKa = 4.43TIWTYY248 pKa = 10.49NQGVVIGGLAEE259 pKa = 3.95LHH261 pKa = 6.2RR262 pKa = 11.84SVSNSSNSSYY272 pKa = 11.4LDD274 pKa = 3.35MAEE277 pKa = 4.88KK278 pKa = 9.89IAKK281 pKa = 10.16ASIDD285 pKa = 3.6EE286 pKa = 4.5LADD289 pKa = 3.71DD290 pKa = 4.35NYY292 pKa = 10.75VIRR295 pKa = 11.84EE296 pKa = 4.17SCEE299 pKa = 3.7PDD301 pKa = 3.11CDD303 pKa = 4.57ANATQFKK310 pKa = 10.81GIFIRR315 pKa = 11.84NLKK318 pKa = 9.37LLHH321 pKa = 6.55SVAPDD326 pKa = 3.36DD327 pKa = 4.43VYY329 pKa = 11.64EE330 pKa = 4.13KK331 pKa = 10.77VIRR334 pKa = 11.84ACADD338 pKa = 3.88SIWDD342 pKa = 3.69NDD344 pKa = 3.76RR345 pKa = 11.84DD346 pKa = 3.8EE347 pKa = 4.49QNQFGINWAGPVSAIDD363 pKa = 3.74ASTHH367 pKa = 5.38SSAMDD372 pKa = 3.88ALVAAIDD379 pKa = 3.73EE380 pKa = 4.57DD381 pKa = 4.01
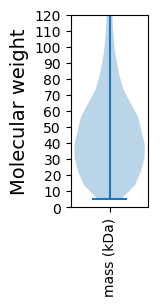
Molecular weight: 41.59 kDa
Isoelectric point according different methods:
Protein with the highest isoelectric point:
>tr|A0A2I2GGM0|A0A2I2GGM0_9EURO Putative apoptosis-inducing factor OS=Aspergillus steynii IBT 23096 OX=1392250 GN=P170DRAFT_348257 PE=4 SV=1
SS1 pKa = 6.85HH2 pKa = 7.5KK3 pKa = 10.71SFRR6 pKa = 11.84TKK8 pKa = 10.45QKK10 pKa = 9.84LAKK13 pKa = 9.55AQKK16 pKa = 8.59QNRR19 pKa = 11.84PIPQWIRR26 pKa = 11.84LRR28 pKa = 11.84TGNTIRR34 pKa = 11.84YY35 pKa = 5.79NAKK38 pKa = 8.89RR39 pKa = 11.84RR40 pKa = 11.84HH41 pKa = 4.14WRR43 pKa = 11.84KK44 pKa = 7.41TRR46 pKa = 11.84LGII49 pKa = 4.46
SS1 pKa = 6.85HH2 pKa = 7.5KK3 pKa = 10.71SFRR6 pKa = 11.84TKK8 pKa = 10.45QKK10 pKa = 9.84LAKK13 pKa = 9.55AQKK16 pKa = 8.59QNRR19 pKa = 11.84PIPQWIRR26 pKa = 11.84LRR28 pKa = 11.84TGNTIRR34 pKa = 11.84YY35 pKa = 5.79NAKK38 pKa = 8.89RR39 pKa = 11.84RR40 pKa = 11.84HH41 pKa = 4.14WRR43 pKa = 11.84KK44 pKa = 7.41TRR46 pKa = 11.84LGII49 pKa = 4.46
Molecular weight: 6.03 kDa
Isoelectric point according different methods:
Peptides (in silico digests for buttom-up proteomics)
Below you can find in silico digests of the whole proteome with Trypsin, Chymotrypsin, Trypsin+LysC, LysN, ArgC proteases suitable for different mass spec machines.| Try ESI |
 |
|---|
| ChTry ESI |
 |
|---|
| ArgC ESI |
 |
|---|
| LysN ESI |
 |
|---|
| TryLysC ESI |
 |
|---|
| Try MALDI |
 |
|---|
| ChTry MALDI |
 |
|---|
| ArgC MALDI |
 |
|---|
| LysN MALDI |
 |
|---|
| TryLysC MALDI |
 |
|---|
| Try LTQ |
 |
|---|
| ChTry LTQ |
 |
|---|
| ArgC LTQ |
 |
|---|
| LysN LTQ |
 |
|---|
| TryLysC LTQ |
 |
|---|
| Try MSlow |
 |
|---|
| ChTry MSlow |
 |
|---|
| ArgC MSlow |
 |
|---|
| LysN MSlow |
 |
|---|
| TryLysC MSlow |
 |
|---|
| Try MShigh |
 |
|---|
| ChTry MShigh |
 |
|---|
| ArgC MShigh |
 |
|---|
| LysN MShigh |
 |
|---|
| TryLysC MShigh |
 |
|---|
General Statistics
Number of major isoforms |
Number of additional isoforms |
Number of all proteins |
Number of amino acids |
Min. Seq. Length |
Max. Seq. Length |
Avg. Seq. Length |
Avg. Mol. Weight |
|---|---|---|---|---|---|---|---|
6073799 |
49 |
7729 |
468.5 |
51.89 |
Amino acid frequency
Ala |
Cys |
Asp |
Glu |
Phe |
Gly |
His |
Ile |
Lys |
Leu |
|---|---|---|---|---|---|---|---|---|---|
8.406 ± 0.019 | 1.329 ± 0.008 |
5.683 ± 0.016 | 6.005 ± 0.022 |
3.882 ± 0.012 | 6.903 ± 0.016 |
2.478 ± 0.008 | 4.917 ± 0.015 |
4.407 ± 0.017 | 9.175 ± 0.021 |
Met |
Asn |
Gln |
Pro |
Arg |
Ser |
Thr |
Val |
Trp |
Tyr |
|---|---|---|---|---|---|---|---|---|---|
2.18 ± 0.008 | 3.576 ± 0.01 |
6.099 ± 0.024 | 4.012 ± 0.014 |
6.171 ± 0.019 | 8.369 ± 0.022 |
5.796 ± 0.014 | 6.258 ± 0.016 |
1.52 ± 0.008 | 2.834 ± 0.01 |
Most of the basic statistics you can see at this page can be downloaded from this CSV file
Proteome-pI is available under Creative Commons Attribution-NoDerivs license, for more details see here
| Reference: Kozlowski LP. Proteome-pI 2.0: Proteome Isoelectric Point Database Update. Nucleic Acids Res. 2021, doi: 10.1093/nar/gkab944 | Contact: Lukasz P. Kozlowski |
