Pepino mosaic virus
Taxonomy: Viruses; Riboviria; Orthornavirae; Kitrinoviricota; Alsuviricetes; Tymovirales; Alphaflexiviridae; Potexvirus
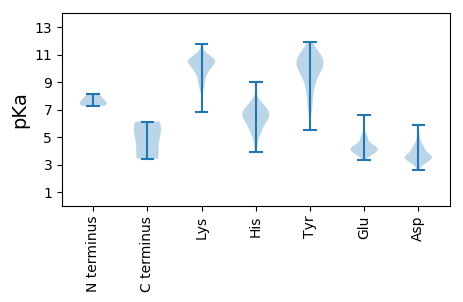
Average proteome isoelectric point is 6.51
Get precalculated fractions of proteins

Virtual 2D-PAGE plot for 5 proteins (isoelectric point calculated using IPC2_protein)
Get csv file with sequences according to given criteria:
* You can choose from 21 different methods for calculating isoelectric point
Summary statistics related to proteome-wise predictions


Protein with the lowest isoelectric point:
>tr|Q8JSN4|Q8JSN4_9VIRU ORF1 protein OS=Pepino mosaic virus OX=112229 PE=4 SV=1
MM1 pKa = 7.35EE2 pKa = 5.96RR3 pKa = 11.84STLINLLQLHH13 pKa = 6.18HH14 pKa = 6.95FEE16 pKa = 5.1PKK18 pKa = 10.42LSVEE22 pKa = 4.17GTIVVHH28 pKa = 6.84GIAGTGKK35 pKa = 7.05TTLLRR40 pKa = 11.84TLFSAYY46 pKa = 8.77PSLVIGSPRR55 pKa = 11.84PCYY58 pKa = 10.13LDD60 pKa = 3.3KK61 pKa = 11.07QNKK64 pKa = 8.56ISQVCLSCFPNTHH77 pKa = 6.59CDD79 pKa = 3.19IVDD82 pKa = 3.84EE83 pKa = 4.24YY84 pKa = 11.51HH85 pKa = 6.9LLEE88 pKa = 5.05SFLEE92 pKa = 4.15PKK94 pKa = 10.3LAIFGDD100 pKa = 4.36PCQCTYY106 pKa = 10.57IEE108 pKa = 4.43RR109 pKa = 11.84LRR111 pKa = 11.84VPHH114 pKa = 5.05YY115 pKa = 9.89TSFRR119 pKa = 11.84THH121 pKa = 7.07RR122 pKa = 11.84FGKK125 pKa = 8.37STAEE129 pKa = 3.82ILNKK133 pKa = 10.34LFDD136 pKa = 4.75LNIVSVKK143 pKa = 10.62KK144 pKa = 10.56EE145 pKa = 3.7DD146 pKa = 5.14DD147 pKa = 3.11IVEE150 pKa = 4.38FFNPFEE156 pKa = 4.28VDD158 pKa = 3.24PTEE161 pKa = 5.01HH162 pKa = 6.6ISASEE167 pKa = 4.16EE168 pKa = 3.87EE169 pKa = 4.43VLDD172 pKa = 4.17FVSDD176 pKa = 3.83QVVTTSSEE184 pKa = 3.87EE185 pKa = 3.84LAGLEE190 pKa = 4.07FAEE193 pKa = 4.59TTFYY197 pKa = 10.41CTTLAAAVAEE207 pKa = 4.45NPAKK211 pKa = 10.14TFISLTRR218 pKa = 11.84HH219 pKa = 3.93THH221 pKa = 5.71KK222 pKa = 10.47LTIGEE227 pKa = 4.14LNARR231 pKa = 11.84SNSS234 pKa = 3.46
MM1 pKa = 7.35EE2 pKa = 5.96RR3 pKa = 11.84STLINLLQLHH13 pKa = 6.18HH14 pKa = 6.95FEE16 pKa = 5.1PKK18 pKa = 10.42LSVEE22 pKa = 4.17GTIVVHH28 pKa = 6.84GIAGTGKK35 pKa = 7.05TTLLRR40 pKa = 11.84TLFSAYY46 pKa = 8.77PSLVIGSPRR55 pKa = 11.84PCYY58 pKa = 10.13LDD60 pKa = 3.3KK61 pKa = 11.07QNKK64 pKa = 8.56ISQVCLSCFPNTHH77 pKa = 6.59CDD79 pKa = 3.19IVDD82 pKa = 3.84EE83 pKa = 4.24YY84 pKa = 11.51HH85 pKa = 6.9LLEE88 pKa = 5.05SFLEE92 pKa = 4.15PKK94 pKa = 10.3LAIFGDD100 pKa = 4.36PCQCTYY106 pKa = 10.57IEE108 pKa = 4.43RR109 pKa = 11.84LRR111 pKa = 11.84VPHH114 pKa = 5.05YY115 pKa = 9.89TSFRR119 pKa = 11.84THH121 pKa = 7.07RR122 pKa = 11.84FGKK125 pKa = 8.37STAEE129 pKa = 3.82ILNKK133 pKa = 10.34LFDD136 pKa = 4.75LNIVSVKK143 pKa = 10.62KK144 pKa = 10.56EE145 pKa = 3.7DD146 pKa = 5.14DD147 pKa = 3.11IVEE150 pKa = 4.38FFNPFEE156 pKa = 4.28VDD158 pKa = 3.24PTEE161 pKa = 5.01HH162 pKa = 6.6ISASEE167 pKa = 4.16EE168 pKa = 3.87EE169 pKa = 4.43VLDD172 pKa = 4.17FVSDD176 pKa = 3.83QVVTTSSEE184 pKa = 3.87EE185 pKa = 3.84LAGLEE190 pKa = 4.07FAEE193 pKa = 4.59TTFYY197 pKa = 10.41CTTLAAAVAEE207 pKa = 4.45NPAKK211 pKa = 10.14TFISLTRR218 pKa = 11.84HH219 pKa = 3.93THH221 pKa = 5.71KK222 pKa = 10.47LTIGEE227 pKa = 4.14LNARR231 pKa = 11.84SNSS234 pKa = 3.46
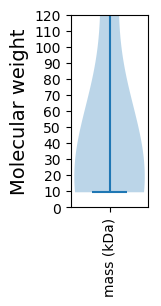
Molecular weight: 26.27 kDa
Isoelectric point according different methods:
Protein with the highest isoelectric point:
>tr|Q8JSN2|Q8JSN2_9VIRU Movement protein TGBp3 OS=Pepino mosaic virus OX=112229 GN=TGBp3 PE=3 SV=1
MM1 pKa = 7.76PGLTPRR7 pKa = 11.84ADD9 pKa = 3.32LTDD12 pKa = 3.49TYY14 pKa = 10.87KK15 pKa = 10.66IIAIAFLLSACIYY28 pKa = 8.34FQNSHH33 pKa = 5.34YY34 pKa = 10.83QPVAGDD40 pKa = 3.55NLHH43 pKa = 6.77RR44 pKa = 11.84LPFGGQYY51 pKa = 10.32QDD53 pKa = 3.23GTKK56 pKa = 10.04KK57 pKa = 10.19ISYY60 pKa = 9.45FPQQQSYY67 pKa = 7.44FHH69 pKa = 6.99SGNKK73 pKa = 10.02LNVLILIFILTLGIVLTNKK92 pKa = 9.85FSFSFSRR99 pKa = 11.84TTHH102 pKa = 4.58QHH104 pKa = 3.95SCYY107 pKa = 8.65NTHH110 pKa = 6.59SATNNTQPLSGHH122 pKa = 6.13HH123 pKa = 6.13
MM1 pKa = 7.76PGLTPRR7 pKa = 11.84ADD9 pKa = 3.32LTDD12 pKa = 3.49TYY14 pKa = 10.87KK15 pKa = 10.66IIAIAFLLSACIYY28 pKa = 8.34FQNSHH33 pKa = 5.34YY34 pKa = 10.83QPVAGDD40 pKa = 3.55NLHH43 pKa = 6.77RR44 pKa = 11.84LPFGGQYY51 pKa = 10.32QDD53 pKa = 3.23GTKK56 pKa = 10.04KK57 pKa = 10.19ISYY60 pKa = 9.45FPQQQSYY67 pKa = 7.44FHH69 pKa = 6.99SGNKK73 pKa = 10.02LNVLILIFILTLGIVLTNKK92 pKa = 9.85FSFSFSRR99 pKa = 11.84TTHH102 pKa = 4.58QHH104 pKa = 3.95SCYY107 pKa = 8.65NTHH110 pKa = 6.59SATNNTQPLSGHH122 pKa = 6.13HH123 pKa = 6.13
Molecular weight: 13.88 kDa
Isoelectric point according different methods:
Peptides (in silico digests for buttom-up proteomics)
Below you can find in silico digests of the whole proteome with Trypsin, Chymotrypsin, Trypsin+LysC, LysN, ArgC proteases suitable for different mass spec machines.| Try ESI |
 |
|---|
| ChTry ESI |
 |
|---|
| ArgC ESI |
 |
|---|
| LysN ESI |
 |
|---|
| TryLysC ESI |
 |
|---|
| Try MALDI |
 |
|---|
| ChTry MALDI |
 |
|---|
| ArgC MALDI |
 |
|---|
| LysN MALDI |
 |
|---|
| TryLysC MALDI |
 |
|---|
| Try LTQ |
 |
|---|
| ChTry LTQ |
 |
|---|
| ArgC LTQ |
 |
|---|
| LysN LTQ |
 |
|---|
| TryLysC LTQ |
 |
|---|
| Try MSlow |
 |
|---|
| ChTry MSlow |
 |
|---|
| ArgC MSlow |
 |
|---|
| LysN MSlow |
 |
|---|
| TryLysC MSlow |
 |
|---|
| Try MShigh |
 |
|---|
| ChTry MShigh |
 |
|---|
| ArgC MShigh |
 |
|---|
| LysN MShigh |
 |
|---|
| TryLysC MShigh |
 |
|---|
General Statistics
Number of major isoforms |
Number of additional isoforms |
Number of all proteins |
Number of amino acids |
Min. Seq. Length |
Max. Seq. Length |
Avg. Seq. Length |
Avg. Mol. Weight |
|---|---|---|---|---|---|---|---|
0 |
2117 |
84 |
1439 |
423.4 |
47.66 |
Amino acid frequency
Ala |
Cys |
Asp |
Glu |
Phe |
Gly |
His |
Ile |
Lys |
Leu |
|---|---|---|---|---|---|---|---|---|---|
8.314 ± 1.144 | 1.606 ± 0.251 |
4.818 ± 0.454 | 5.668 ± 0.879 |
5.102 ± 0.35 | 4.251 ± 0.334 |
3.637 ± 0.443 | 6.141 ± 0.492 |
6.046 ± 0.771 | 8.88 ± 0.589 |
Met |
Asn |
Gln |
Pro |
Arg |
Ser |
Thr |
Val |
Trp |
Tyr |
|---|---|---|---|---|---|---|---|---|---|
2.031 ± 0.408 | 5.574 ± 0.367 |
5.243 ± 0.489 | 4.44 ± 0.571 |
3.826 ± 0.42 | 7.227 ± 0.79 |
7.227 ± 0.611 | 5.338 ± 0.346 |
0.897 ± 0.209 | 3.732 ± 0.446 |
Most of the basic statistics you can see at this page can be downloaded from this CSV file
Proteome-pI is available under Creative Commons Attribution-NoDerivs license, for more details see here
| Reference: Kozlowski LP. Proteome-pI 2.0: Proteome Isoelectric Point Database Update. Nucleic Acids Res. 2021, doi: 10.1093/nar/gkab944 | Contact: Lukasz P. Kozlowski |
