Chlorogloea sp. CCALA 695
Taxonomy: cellular organisms; Bacteria; Terrabacteria group; Cyanobacteria/Melainabacteria group; Cyanobacteria; Oscillatoriophycideae; Chroococcales; Entophysalidaceae; Chlorogloea; unclassified Chlorogloea
Average proteome isoelectric point is 6.49
Get precalculated fractions of proteins

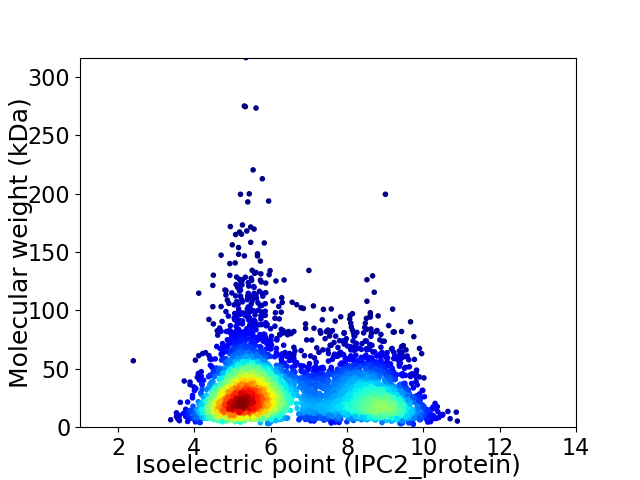
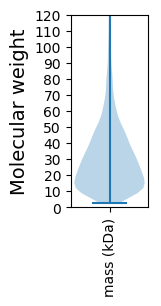
Virtual 2D-PAGE plot for 4747 proteins (isoelectric point calculated using IPC2_protein)
Get csv file with sequences according to given criteria:
* You can choose from 21 different methods for calculating isoelectric point
Summary statistics related to proteome-wise predictions


Protein with the lowest isoelectric point:
>tr|A0A2T1E8H0|A0A2T1E8H0_9CHRO Phosphate starvation-inducible protein PhoH OS=Chlorogloea sp. CCALA 695 OX=2107693 GN=C7B70_19500 PE=4 SV=1
MM1 pKa = 7.71DD2 pKa = 3.75TPFTFEE8 pKa = 5.23QEE10 pKa = 3.67TDD12 pKa = 3.1LNAWYY17 pKa = 9.27DD18 pKa = 3.78QLNSAWQAKK27 pKa = 9.17IADD30 pKa = 4.2PNSPEE35 pKa = 4.15SLSLAEE41 pKa = 5.51AEE43 pKa = 4.85AYY45 pKa = 9.07WEE47 pKa = 4.11AEE49 pKa = 3.42RR50 pKa = 11.84EE51 pKa = 4.24YY52 pKa = 10.82YY53 pKa = 10.03HH54 pKa = 7.72DD55 pKa = 3.93RR56 pKa = 11.84FLYY59 pKa = 10.79ADD61 pKa = 3.85IFF63 pKa = 4.01
MM1 pKa = 7.71DD2 pKa = 3.75TPFTFEE8 pKa = 5.23QEE10 pKa = 3.67TDD12 pKa = 3.1LNAWYY17 pKa = 9.27DD18 pKa = 3.78QLNSAWQAKK27 pKa = 9.17IADD30 pKa = 4.2PNSPEE35 pKa = 4.15SLSLAEE41 pKa = 5.51AEE43 pKa = 4.85AYY45 pKa = 9.07WEE47 pKa = 4.11AEE49 pKa = 3.42RR50 pKa = 11.84EE51 pKa = 4.24YY52 pKa = 10.82YY53 pKa = 10.03HH54 pKa = 7.72DD55 pKa = 3.93RR56 pKa = 11.84FLYY59 pKa = 10.79ADD61 pKa = 3.85IFF63 pKa = 4.01
Molecular weight: 7.52 kDa
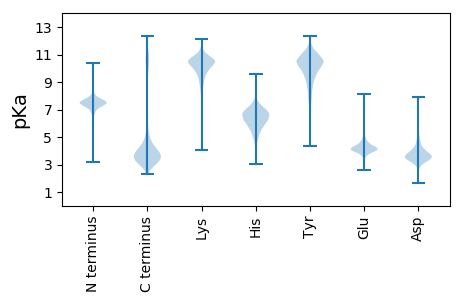
Isoelectric point according different methods:
Protein with the highest isoelectric point:
>tr|A0A2T1ENE8|A0A2T1ENE8_9CHRO DUF3893 domain-containing protein OS=Chlorogloea sp. CCALA 695 OX=2107693 GN=C7B70_04265 PE=4 SV=1
MM1 pKa = 7.58TEE3 pKa = 4.59FIVPQTSAKK12 pKa = 8.91AQKK15 pKa = 10.26HH16 pKa = 5.34SAPQDD21 pKa = 3.51RR22 pKa = 11.84IRR24 pKa = 11.84RR25 pKa = 11.84WVWKK29 pKa = 10.12LCIATLILMAIGSTTRR45 pKa = 11.84VMNAGLACPDD55 pKa = 3.16WPLCYY60 pKa = 9.36GTLVPRR66 pKa = 11.84AQMNLQVFLEE76 pKa = 4.36WFHH79 pKa = 7.71RR80 pKa = 11.84LDD82 pKa = 3.41AALIGVGALSLSVICWWNRR101 pKa = 11.84RR102 pKa = 11.84QLPGWLPWAATFALGLIMFQGVLGGLTVTQLLRR135 pKa = 11.84FDD137 pKa = 4.01IVTAHH142 pKa = 7.45LGTALLFFSTLLVMGTALTPYY163 pKa = 9.89QGTGTAGKK171 pKa = 10.06LPWLGLTAAILVYY184 pKa = 10.38LQSLLGALVASRR196 pKa = 11.84WALHH200 pKa = 5.34QCLTVKK206 pKa = 10.46ALCSVMYY213 pKa = 9.19SHH215 pKa = 7.43IGFVVLPSLAIIAVVWMSWRR235 pKa = 11.84TPALHH240 pKa = 5.92PTLRR244 pKa = 11.84LLANMTGGLLLLQILLGIATLRR266 pKa = 11.84LHH268 pKa = 6.52LQIEE272 pKa = 4.74PLTVAHH278 pKa = 5.76QAVGAALLGSLVIFTVLGWRR298 pKa = 11.84DD299 pKa = 3.41SASAPITGLRR309 pKa = 11.84AFLAARR315 pKa = 4.08
MM1 pKa = 7.58TEE3 pKa = 4.59FIVPQTSAKK12 pKa = 8.91AQKK15 pKa = 10.26HH16 pKa = 5.34SAPQDD21 pKa = 3.51RR22 pKa = 11.84IRR24 pKa = 11.84RR25 pKa = 11.84WVWKK29 pKa = 10.12LCIATLILMAIGSTTRR45 pKa = 11.84VMNAGLACPDD55 pKa = 3.16WPLCYY60 pKa = 9.36GTLVPRR66 pKa = 11.84AQMNLQVFLEE76 pKa = 4.36WFHH79 pKa = 7.71RR80 pKa = 11.84LDD82 pKa = 3.41AALIGVGALSLSVICWWNRR101 pKa = 11.84RR102 pKa = 11.84QLPGWLPWAATFALGLIMFQGVLGGLTVTQLLRR135 pKa = 11.84FDD137 pKa = 4.01IVTAHH142 pKa = 7.45LGTALLFFSTLLVMGTALTPYY163 pKa = 9.89QGTGTAGKK171 pKa = 10.06LPWLGLTAAILVYY184 pKa = 10.38LQSLLGALVASRR196 pKa = 11.84WALHH200 pKa = 5.34QCLTVKK206 pKa = 10.46ALCSVMYY213 pKa = 9.19SHH215 pKa = 7.43IGFVVLPSLAIIAVVWMSWRR235 pKa = 11.84TPALHH240 pKa = 5.92PTLRR244 pKa = 11.84LLANMTGGLLLLQILLGIATLRR266 pKa = 11.84LHH268 pKa = 6.52LQIEE272 pKa = 4.74PLTVAHH278 pKa = 5.76QAVGAALLGSLVIFTVLGWRR298 pKa = 11.84DD299 pKa = 3.41SASAPITGLRR309 pKa = 11.84AFLAARR315 pKa = 4.08
Molecular weight: 34.27 kDa
Isoelectric point according different methods:
Peptides (in silico digests for buttom-up proteomics)
Below you can find in silico digests of the whole proteome with Trypsin, Chymotrypsin, Trypsin+LysC, LysN, ArgC proteases suitable for different mass spec machines.| Try ESI |
 |
|---|
| ChTry ESI |
 |
|---|
| ArgC ESI |
 |
|---|
| LysN ESI |
 |
|---|
| TryLysC ESI |
 |
|---|
| Try MALDI |
 |
|---|
| ChTry MALDI |
 |
|---|
| ArgC MALDI |
 |
|---|
| LysN MALDI |
 |
|---|
| TryLysC MALDI |
 |
|---|
| Try LTQ |
 |
|---|
| ChTry LTQ |
 |
|---|
| ArgC LTQ |
 |
|---|
| LysN LTQ |
 |
|---|
| TryLysC LTQ |
 |
|---|
| Try MSlow |
 |
|---|
| ChTry MSlow |
 |
|---|
| ArgC MSlow |
 |
|---|
| LysN MSlow |
 |
|---|
| TryLysC MSlow |
 |
|---|
| Try MShigh |
 |
|---|
| ChTry MShigh |
 |
|---|
| ArgC MShigh |
 |
|---|
| LysN MShigh |
 |
|---|
| TryLysC MShigh |
 |
|---|
General Statistics
Number of major isoforms |
Number of additional isoforms |
Number of all proteins |
Number of amino acids |
Min. Seq. Length |
Max. Seq. Length |
Avg. Seq. Length |
Avg. Mol. Weight |
|---|---|---|---|---|---|---|---|
0 |
1414214 |
22 |
2885 |
297.9 |
33.13 |
Amino acid frequency
Ala |
Cys |
Asp |
Glu |
Phe |
Gly |
His |
Ile |
Lys |
Leu |
|---|---|---|---|---|---|---|---|---|---|
8.447 ± 0.038 | 1.028 ± 0.012 |
4.8 ± 0.025 | 6.083 ± 0.033 |
3.81 ± 0.019 | 6.504 ± 0.037 |
1.723 ± 0.017 | 6.735 ± 0.025 |
5.079 ± 0.031 | 11.06 ± 0.04 |
Met |
Asn |
Gln |
Pro |
Arg |
Ser |
Thr |
Val |
Trp |
Tyr |
|---|---|---|---|---|---|---|---|---|---|
1.806 ± 0.016 | 4.341 ± 0.027 |
4.62 ± 0.027 | 5.376 ± 0.035 |
5.07 ± 0.025 | 6.596 ± 0.027 |
5.76 ± 0.028 | 6.761 ± 0.032 |
1.395 ± 0.016 | 3.007 ± 0.021 |
Most of the basic statistics you can see at this page can be downloaded from this CSV file
Proteome-pI is available under Creative Commons Attribution-NoDerivs license, for more details see here
| Reference: Kozlowski LP. Proteome-pI 2.0: Proteome Isoelectric Point Database Update. Nucleic Acids Res. 2021, doi: 10.1093/nar/gkab944 | Contact: Lukasz P. Kozlowski |
