Balneolaceae bacterium YR4-1
Taxonomy: cellular organisms; Bacteria; FCB group; Bacteroidetes/Chlorobi group; Balneolaeota; Balneolia; Balneolales; Balneolaceae; unclassified Balneolaceae
Average proteome isoelectric point is 5.69
Get precalculated fractions of proteins

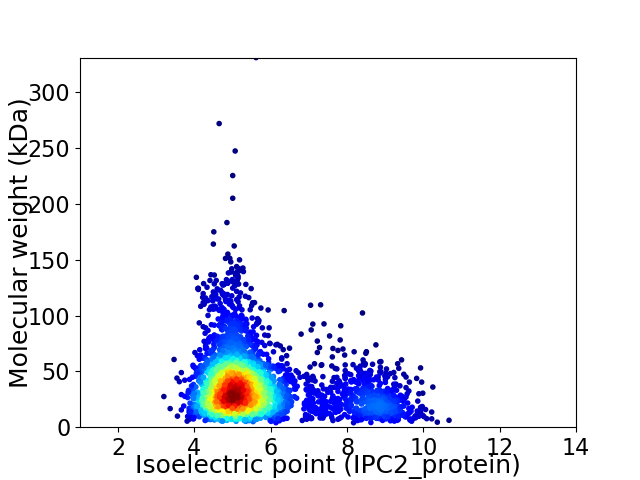
Virtual 2D-PAGE plot for 3201 proteins (isoelectric point calculated using IPC2_protein)
Get csv file with sequences according to given criteria:
* You can choose from 21 different methods for calculating isoelectric point
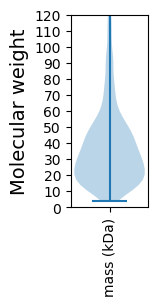
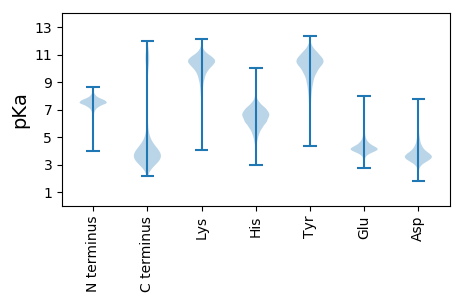
Summary statistics related to proteome-wise predictions


Protein with the lowest isoelectric point:
>tr|A0A6M1SWV8|A0A6M1SWV8_9BACT Cation transporter OS=Balneolaceae bacterium YR4-1 OX=2709311 GN=G3570_02790 PE=4 SV=1
MM1 pKa = 6.98MRR3 pKa = 11.84YY4 pKa = 9.9LGILLSVFIFTSCIEE19 pKa = 4.08SSGTIGPQGPEE30 pKa = 4.39GPPGPIGQAFEE41 pKa = 4.35VEE43 pKa = 4.44ADD45 pKa = 3.57FTEE48 pKa = 4.48NNGYY52 pKa = 6.79TQIFEE57 pKa = 4.33IPPSVEE63 pKa = 4.06IYY65 pKa = 10.7SSDD68 pKa = 2.86IVAVYY73 pKa = 9.43LLWEE77 pKa = 4.29VDD79 pKa = 3.32EE80 pKa = 4.55STGNDD85 pKa = 2.68VWQQLPVSVFFNDD98 pKa = 3.74GQLQYY103 pKa = 11.79AFDD106 pKa = 3.75HH107 pKa = 6.01TVADD111 pKa = 3.61VKK113 pKa = 11.19LFLTGDD119 pKa = 3.71TDD121 pKa = 4.55LSTVGDD127 pKa = 5.14GYY129 pKa = 9.51TLDD132 pKa = 3.35QIFRR136 pKa = 11.84VVVLPAEE143 pKa = 4.39YY144 pKa = 10.08VQEE147 pKa = 4.43NGVDD151 pKa = 3.59MSNMEE156 pKa = 4.3EE157 pKa = 3.95VMGAVKK163 pKa = 10.48KK164 pKa = 10.98GDD166 pKa = 3.34IQRR169 pKa = 11.84ITLL172 pKa = 3.66
MM1 pKa = 6.98MRR3 pKa = 11.84YY4 pKa = 9.9LGILLSVFIFTSCIEE19 pKa = 4.08SSGTIGPQGPEE30 pKa = 4.39GPPGPIGQAFEE41 pKa = 4.35VEE43 pKa = 4.44ADD45 pKa = 3.57FTEE48 pKa = 4.48NNGYY52 pKa = 6.79TQIFEE57 pKa = 4.33IPPSVEE63 pKa = 4.06IYY65 pKa = 10.7SSDD68 pKa = 2.86IVAVYY73 pKa = 9.43LLWEE77 pKa = 4.29VDD79 pKa = 3.32EE80 pKa = 4.55STGNDD85 pKa = 2.68VWQQLPVSVFFNDD98 pKa = 3.74GQLQYY103 pKa = 11.79AFDD106 pKa = 3.75HH107 pKa = 6.01TVADD111 pKa = 3.61VKK113 pKa = 11.19LFLTGDD119 pKa = 3.71TDD121 pKa = 4.55LSTVGDD127 pKa = 5.14GYY129 pKa = 9.51TLDD132 pKa = 3.35QIFRR136 pKa = 11.84VVVLPAEE143 pKa = 4.39YY144 pKa = 10.08VQEE147 pKa = 4.43NGVDD151 pKa = 3.59MSNMEE156 pKa = 4.3EE157 pKa = 3.95VMGAVKK163 pKa = 10.48KK164 pKa = 10.98GDD166 pKa = 3.34IQRR169 pKa = 11.84ITLL172 pKa = 3.66
Molecular weight: 18.96 kDa
Isoelectric point according different methods:
Protein with the highest isoelectric point:
>tr|A0A6M1ST56|A0A6M1ST56_9BACT Na-K-Cl cotransporter OS=Balneolaceae bacterium YR4-1 OX=2709311 GN=G3570_01735 PE=4 SV=1
MM1 pKa = 7.64IKK3 pKa = 10.45NPSHH7 pKa = 6.71PKK9 pKa = 9.37KK10 pKa = 9.81GHH12 pKa = 4.87IRR14 pKa = 11.84TRR16 pKa = 11.84EE17 pKa = 4.0CKK19 pKa = 8.44FTKK22 pKa = 10.45AGIEE26 pKa = 4.11YY27 pKa = 9.39IDD29 pKa = 3.91YY30 pKa = 10.87KK31 pKa = 10.53DD32 pKa = 3.61TEE34 pKa = 4.18VLQRR38 pKa = 11.84FMNDD42 pKa = 2.58QGRR45 pKa = 11.84ILPRR49 pKa = 11.84RR50 pKa = 11.84VTGTSAKK57 pKa = 9.31YY58 pKa = 9.38QRR60 pKa = 11.84QLSRR64 pKa = 11.84AIKK67 pKa = 9.16RR68 pKa = 11.84ARR70 pKa = 11.84FLGMIPYY77 pKa = 9.99VADD80 pKa = 3.47NLRR83 pKa = 3.9
MM1 pKa = 7.64IKK3 pKa = 10.45NPSHH7 pKa = 6.71PKK9 pKa = 9.37KK10 pKa = 9.81GHH12 pKa = 4.87IRR14 pKa = 11.84TRR16 pKa = 11.84EE17 pKa = 4.0CKK19 pKa = 8.44FTKK22 pKa = 10.45AGIEE26 pKa = 4.11YY27 pKa = 9.39IDD29 pKa = 3.91YY30 pKa = 10.87KK31 pKa = 10.53DD32 pKa = 3.61TEE34 pKa = 4.18VLQRR38 pKa = 11.84FMNDD42 pKa = 2.58QGRR45 pKa = 11.84ILPRR49 pKa = 11.84RR50 pKa = 11.84VTGTSAKK57 pKa = 9.31YY58 pKa = 9.38QRR60 pKa = 11.84QLSRR64 pKa = 11.84AIKK67 pKa = 9.16RR68 pKa = 11.84ARR70 pKa = 11.84FLGMIPYY77 pKa = 9.99VADD80 pKa = 3.47NLRR83 pKa = 3.9
Molecular weight: 9.78 kDa
Isoelectric point according different methods:
Peptides (in silico digests for buttom-up proteomics)
Below you can find in silico digests of the whole proteome with Trypsin, Chymotrypsin, Trypsin+LysC, LysN, ArgC proteases suitable for different mass spec machines.| Try ESI |
 |
|---|
| ChTry ESI |
 |
|---|
| ArgC ESI |
 |
|---|
| LysN ESI |
 |
|---|
| TryLysC ESI |
 |
|---|
| Try MALDI |
 |
|---|
| ChTry MALDI |
 |
|---|
| ArgC MALDI |
 |
|---|
| LysN MALDI |
 |
|---|
| TryLysC MALDI |
 |
|---|
| Try LTQ |
 |
|---|
| ChTry LTQ |
 |
|---|
| ArgC LTQ |
 |
|---|
| LysN LTQ |
 |
|---|
| TryLysC LTQ |
 |
|---|
| Try MSlow |
 |
|---|
| ChTry MSlow |
 |
|---|
| ArgC MSlow |
 |
|---|
| LysN MSlow |
 |
|---|
| TryLysC MSlow |
 |
|---|
| Try MShigh |
 |
|---|
| ChTry MShigh |
 |
|---|
| ArgC MShigh |
 |
|---|
| LysN MShigh |
 |
|---|
| TryLysC MShigh |
 |
|---|
General Statistics
Number of major isoforms |
Number of additional isoforms |
Number of all proteins |
Number of amino acids |
Min. Seq. Length |
Max. Seq. Length |
Avg. Seq. Length |
Avg. Mol. Weight |
|---|---|---|---|---|---|---|---|
0 |
1117832 |
35 |
2881 |
349.2 |
39.3 |
Amino acid frequency
Ala |
Cys |
Asp |
Glu |
Phe |
Gly |
His |
Ile |
Lys |
Leu |
|---|---|---|---|---|---|---|---|---|---|
6.731 ± 0.04 | 0.634 ± 0.01 |
6.004 ± 0.033 | 7.736 ± 0.053 |
4.656 ± 0.032 | 7.068 ± 0.042 |
1.91 ± 0.018 | 7.069 ± 0.037 |
5.761 ± 0.045 | 9.477 ± 0.049 |
Met |
Asn |
Gln |
Pro |
Arg |
Ser |
Thr |
Val |
Trp |
Tyr |
|---|---|---|---|---|---|---|---|---|---|
2.434 ± 0.021 | 4.884 ± 0.036 |
3.882 ± 0.022 | 3.63 ± 0.029 |
4.695 ± 0.032 | 6.744 ± 0.038 |
5.379 ± 0.031 | 6.311 ± 0.028 |
1.242 ± 0.019 | 3.754 ± 0.021 |
Most of the basic statistics you can see at this page can be downloaded from this CSV file
Proteome-pI is available under Creative Commons Attribution-NoDerivs license, for more details see here
| Reference: Kozlowski LP. Proteome-pI 2.0: Proteome Isoelectric Point Database Update. Nucleic Acids Res. 2021, doi: 10.1093/nar/gkab944 | Contact: Lukasz P. Kozlowski |
