Nanobsidianus stetteri
Taxonomy: cellular organisms; Archaea; DPANN group; Nanoarchaeota; Nanoarchaeales; Nanopusillaceae; Candidatus Nanobsidianus
Average proteome isoelectric point is 7.01
Get precalculated fractions of proteins
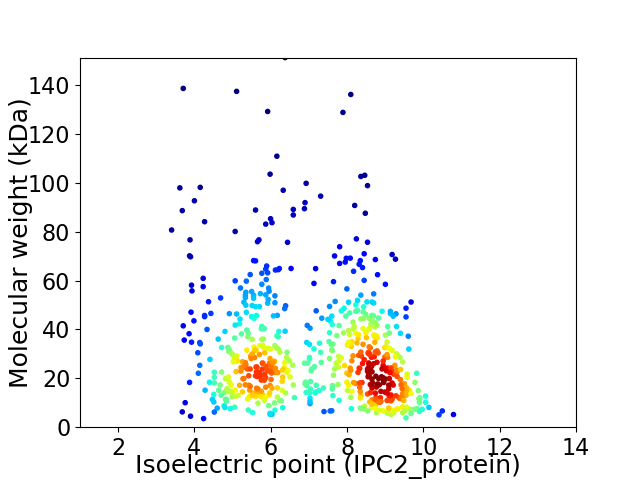
Virtual 2D-PAGE plot for 647 proteins (isoelectric point calculated using IPC2_protein)
Get csv file with sequences according to given criteria:
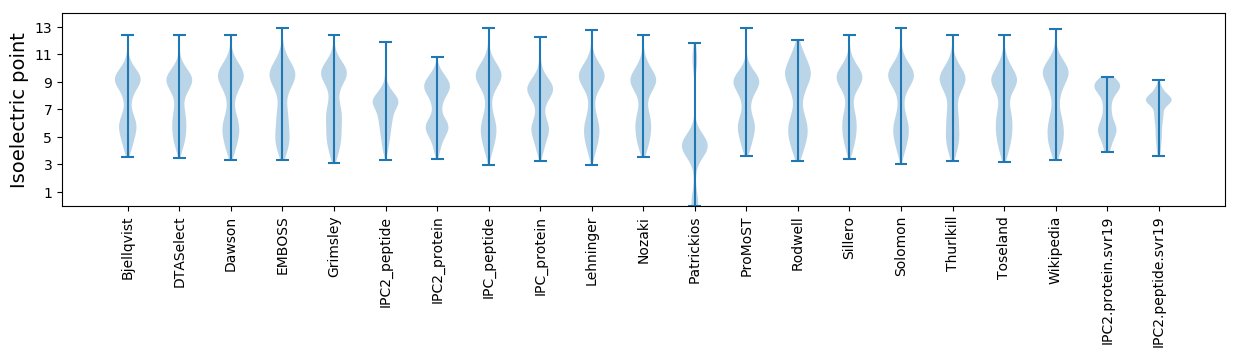
* You can choose from 21 different methods for calculating isoelectric point
Summary statistics related to proteome-wise predictions
Protein with the lowest isoelectric point:
>tr|R1FUB7|R1FUB7_NANST Uncharacterized protein OS=Nanobsidianus stetteri OX=1294122 GN=Nst1_049 PE=4 SV=1
MM1 pKa = 7.8DD2 pKa = 4.08VDD4 pKa = 4.14GLLDD8 pKa = 5.06AIVASIFLIIVSLIGIYY25 pKa = 10.19FPYY28 pKa = 9.84IVARR32 pKa = 11.84IFGTHH37 pKa = 5.53NPYY40 pKa = 10.75LILEE44 pKa = 4.25VAGFITYY51 pKa = 7.62STSEE55 pKa = 4.38PGNMTAAFLVTNAPDD70 pKa = 3.65FFYY73 pKa = 10.24EE74 pKa = 3.98FRR76 pKa = 11.84IIPPIQSSALFIPLYY91 pKa = 10.34NNNDD95 pKa = 3.42FLVSIGEE102 pKa = 4.47CYY104 pKa = 10.82VNNLWQQLADD114 pKa = 3.73DD115 pKa = 4.99ALNSFLTEE123 pKa = 3.92VFSYY127 pKa = 11.1LPGLKK132 pKa = 10.16NGVITKK138 pKa = 9.7PLADD142 pKa = 3.62VLNDD146 pKa = 3.39VFKK149 pKa = 11.13SSSQIAKK156 pKa = 7.96QTAIGAAGMYY166 pKa = 10.42GLYY169 pKa = 9.74TYY171 pKa = 10.94QSTLLQYY178 pKa = 10.67TSGNYY183 pKa = 9.84NIWGDD188 pKa = 3.59IFNALQSSVGPTLWSTVEE206 pKa = 3.72FTIMQVGDD214 pKa = 4.19MILDD218 pKa = 3.61EE219 pKa = 4.75TLPPPADD226 pKa = 3.76FVAGFAFNLAFTSAITLYY244 pKa = 10.51QYY246 pKa = 9.83WQDD249 pKa = 3.02TSNPYY254 pKa = 10.24ASCYY258 pKa = 9.62YY259 pKa = 10.66NQFIQQNTKK268 pKa = 10.29FLFLSIPNGEE278 pKa = 4.16YY279 pKa = 9.57TVYY282 pKa = 10.48QPYY285 pKa = 8.74LTLTIYY291 pKa = 10.42YY292 pKa = 9.57NPNFTFYY299 pKa = 10.74NGCNDD304 pKa = 3.74YY305 pKa = 10.69YY306 pKa = 11.53LCDD309 pKa = 3.25TSFTYY314 pKa = 9.94IYY316 pKa = 10.26DD317 pKa = 4.05PQDD320 pKa = 3.28NSQDD324 pKa = 3.83NIFKK328 pKa = 10.68LDD330 pKa = 4.06LGNVDD335 pKa = 3.64NNGNQVFPEE344 pKa = 4.55FIILSKK350 pKa = 11.17VGMQSGGPYY359 pKa = 10.24LNVSILSSTLSS370 pKa = 3.24
MM1 pKa = 7.8DD2 pKa = 4.08VDD4 pKa = 4.14GLLDD8 pKa = 5.06AIVASIFLIIVSLIGIYY25 pKa = 10.19FPYY28 pKa = 9.84IVARR32 pKa = 11.84IFGTHH37 pKa = 5.53NPYY40 pKa = 10.75LILEE44 pKa = 4.25VAGFITYY51 pKa = 7.62STSEE55 pKa = 4.38PGNMTAAFLVTNAPDD70 pKa = 3.65FFYY73 pKa = 10.24EE74 pKa = 3.98FRR76 pKa = 11.84IIPPIQSSALFIPLYY91 pKa = 10.34NNNDD95 pKa = 3.42FLVSIGEE102 pKa = 4.47CYY104 pKa = 10.82VNNLWQQLADD114 pKa = 3.73DD115 pKa = 4.99ALNSFLTEE123 pKa = 3.92VFSYY127 pKa = 11.1LPGLKK132 pKa = 10.16NGVITKK138 pKa = 9.7PLADD142 pKa = 3.62VLNDD146 pKa = 3.39VFKK149 pKa = 11.13SSSQIAKK156 pKa = 7.96QTAIGAAGMYY166 pKa = 10.42GLYY169 pKa = 9.74TYY171 pKa = 10.94QSTLLQYY178 pKa = 10.67TSGNYY183 pKa = 9.84NIWGDD188 pKa = 3.59IFNALQSSVGPTLWSTVEE206 pKa = 3.72FTIMQVGDD214 pKa = 4.19MILDD218 pKa = 3.61EE219 pKa = 4.75TLPPPADD226 pKa = 3.76FVAGFAFNLAFTSAITLYY244 pKa = 10.51QYY246 pKa = 9.83WQDD249 pKa = 3.02TSNPYY254 pKa = 10.24ASCYY258 pKa = 9.62YY259 pKa = 10.66NQFIQQNTKK268 pKa = 10.29FLFLSIPNGEE278 pKa = 4.16YY279 pKa = 9.57TVYY282 pKa = 10.48QPYY285 pKa = 8.74LTLTIYY291 pKa = 10.42YY292 pKa = 9.57NPNFTFYY299 pKa = 10.74NGCNDD304 pKa = 3.74YY305 pKa = 10.69YY306 pKa = 11.53LCDD309 pKa = 3.25TSFTYY314 pKa = 9.94IYY316 pKa = 10.26DD317 pKa = 4.05PQDD320 pKa = 3.28NSQDD324 pKa = 3.83NIFKK328 pKa = 10.68LDD330 pKa = 4.06LGNVDD335 pKa = 3.64NNGNQVFPEE344 pKa = 4.55FIILSKK350 pKa = 11.17VGMQSGGPYY359 pKa = 10.24LNVSILSSTLSS370 pKa = 3.24
Molecular weight: 41.46 kDa
Isoelectric point according different methods:
Protein with the highest isoelectric point:
>tr|R1G363|R1G363_NANST Uncharacterized protein OS=Nanobsidianus stetteri OX=1294122 GN=Nst1_231 PE=4 SV=1
MM1 pKa = 7.12TRR3 pKa = 11.84LGGTNKK9 pKa = 9.43VNHH12 pKa = 6.51VICRR16 pKa = 11.84RR17 pKa = 11.84CGRR20 pKa = 11.84KK21 pKa = 7.72TYY23 pKa = 10.84NPDD26 pKa = 2.78KK27 pKa = 10.43GYY29 pKa = 10.69CSHH32 pKa = 7.13CGFGRR37 pKa = 11.84SSKK40 pKa = 9.74IRR42 pKa = 11.84AYY44 pKa = 9.17VWSYY48 pKa = 10.06KK49 pKa = 10.07FKK51 pKa = 10.98RR52 pKa = 11.84KK53 pKa = 7.18WW54 pKa = 3.02
MM1 pKa = 7.12TRR3 pKa = 11.84LGGTNKK9 pKa = 9.43VNHH12 pKa = 6.51VICRR16 pKa = 11.84RR17 pKa = 11.84CGRR20 pKa = 11.84KK21 pKa = 7.72TYY23 pKa = 10.84NPDD26 pKa = 2.78KK27 pKa = 10.43GYY29 pKa = 10.69CSHH32 pKa = 7.13CGFGRR37 pKa = 11.84SSKK40 pKa = 9.74IRR42 pKa = 11.84AYY44 pKa = 9.17VWSYY48 pKa = 10.06KK49 pKa = 10.07FKK51 pKa = 10.98RR52 pKa = 11.84KK53 pKa = 7.18WW54 pKa = 3.02
Molecular weight: 6.4 kDa
Isoelectric point according different methods:
Peptides (in silico digests for buttom-up proteomics)
Below you can find in silico digests of the whole proteome with Trypsin, Chymotrypsin, Trypsin+LysC, LysN, ArgC proteases suitable for different mass spec machines.| Try ESI |
 |
|---|
| ChTry ESI |
|
|---|
| ArgC ESI |
|
|---|
| LysN ESI |
|
|---|
| TryLysC ESI |
|
|---|
| Try MALDI |
|
|---|
| ChTry MALDI |
|
|---|
| ArgC MALDI |
|
|---|
| LysN MALDI |
|
|---|
| TryLysC MALDI |
|
|---|
| Try LTQ |
|
|---|
| ChTry LTQ |
|
|---|
| ArgC LTQ |
|
|---|
| LysN LTQ |
|
|---|
| TryLysC LTQ |
|
|---|
| Try MSlow |
|
|---|
| ChTry MSlow |
|
|---|
| ArgC MSlow |
|
|---|
| LysN MSlow |
|
|---|
| TryLysC MSlow |
|
|---|
| Try MShigh |
|
|---|
| ChTry MShigh |
|
|---|
| ArgC MShigh |
|
|---|
| LysN MShigh |
|
|---|
| TryLysC MShigh |
|
|---|
General Statistics
Number of major isoforms |
Number of additional isoforms |
Number of all proteins |
Number of amino acids |
Min. Seq. Length |
Max. Seq. Length |
Avg. Seq. Length |
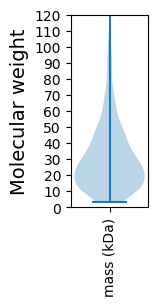
Avg. Mol. Weight |
|---|---|---|---|---|---|---|---|
0 |
178873 |
31 |
1299 |
276.5 |
32.1 |
Amino acid frequency
Ala |
Cys |
Asp |
Glu |
Phe |
Gly |
His |
Ile |
Lys |
Leu |
|---|---|---|---|---|---|---|---|---|---|
3.67 ± 0.083 | 0.591 ± 0.033 |
4.968 ± 0.093 | 7.237 ± 0.148 |
4.746 ± 0.071 | 5.168 ± 0.088 |
0.985 ± 0.037 | 12.505 ± 0.126 |
9.516 ± 0.183 | 10.085 ± 0.108 |
Met |
Asn |
Gln |
Pro |
Arg |
Ser |
Thr |
Val |
Trp |
Tyr |
|---|---|---|---|---|---|---|---|---|---|
1.62 ± 0.039 | 7.661 ± 0.173 |
3.16 ± 0.069 | 2.283 ± 0.086 |
3.393 ± 0.097 | 5.942 ± 0.099 |
3.893 ± 0.102 | 5.059 ± 0.092 |
0.782 ± 0.027 | 6.737 ± 0.135 |
Most of the basic statistics you can see at this page can be downloaded from this CSV file
See this proteome in:

Proteome-pI is available under Creative Commons Attribution-NoDerivs license, for more details see here
| Reference: Kozlowski LP. Proteome-pI 2.0: Proteome Isoelectric Point Database Update. Nucleic Acids Res. 2021, doi: 10.1093/nar/gkab944 | Contact: Lukasz P. Kozlowski |