Rubus canadensis virus 1
Taxonomy: Viruses; Riboviria; Orthornavirae; Kitrinoviricota; Alsuviricetes; Tymovirales; Betaflexiviridae; Quinvirinae; Foveavirus
Average proteome isoelectric point is 6.57
Get precalculated fractions of proteins
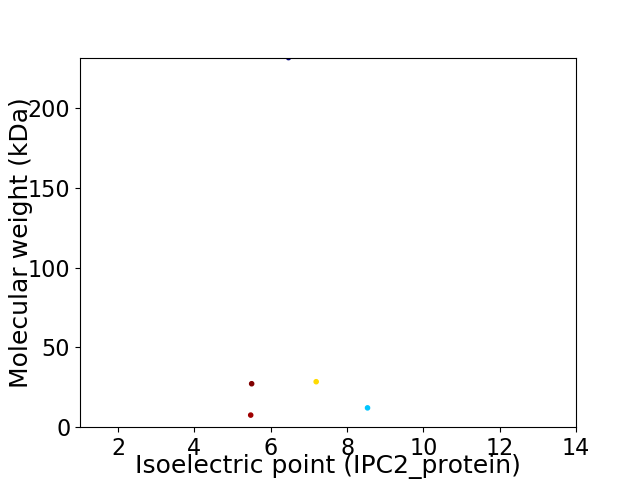
Virtual 2D-PAGE plot for 5 proteins (isoelectric point calculated using IPC2_protein)
Get csv file with sequences according to given criteria:
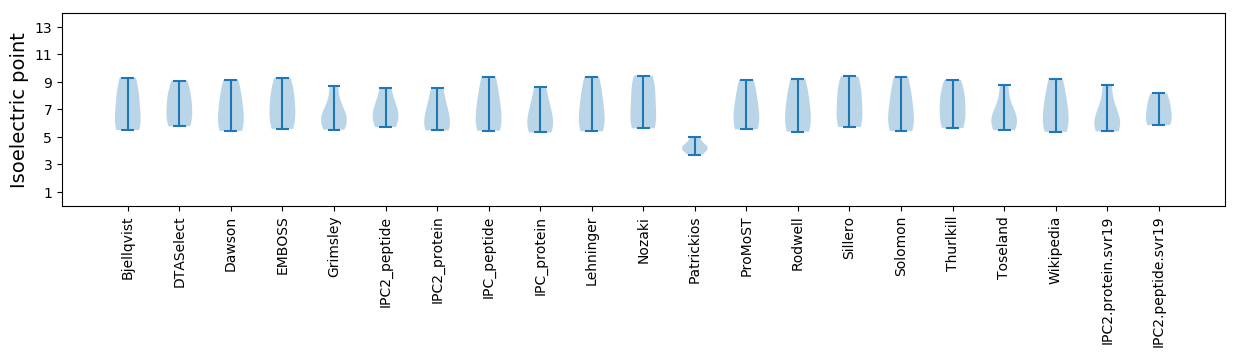
* You can choose from 21 different methods for calculating isoelectric point
Summary statistics related to proteome-wise predictions
Protein with the lowest isoelectric point:
>tr|K4MTI1|K4MTI1_9VIRU Helicase OS=Rubus canadensis virus 1 OX=1243178 PE=3 SV=1
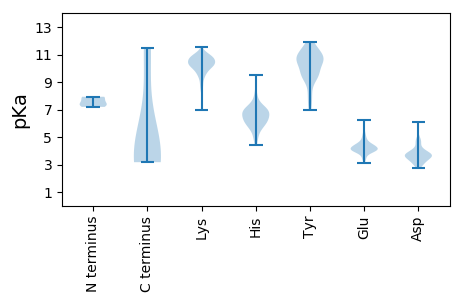
MM1 pKa = 7.19LQINLVVVVLVSVFVVLVLTIIDD24 pKa = 3.5KK25 pKa = 10.56FEE27 pKa = 4.3RR28 pKa = 11.84EE29 pKa = 4.37NPCFIQITGEE39 pKa = 4.11SVVIKK44 pKa = 10.81GCLFDD49 pKa = 4.88KK50 pKa = 11.1DD51 pKa = 4.34FIEE54 pKa = 4.45LVKK57 pKa = 10.59GLKK60 pKa = 9.63PFHH63 pKa = 6.96HH64 pKa = 6.74EE65 pKa = 4.01LGG67 pKa = 3.82
MM1 pKa = 7.19LQINLVVVVLVSVFVVLVLTIIDD24 pKa = 3.5KK25 pKa = 10.56FEE27 pKa = 4.3RR28 pKa = 11.84EE29 pKa = 4.37NPCFIQITGEE39 pKa = 4.11SVVIKK44 pKa = 10.81GCLFDD49 pKa = 4.88KK50 pKa = 11.1DD51 pKa = 4.34FIEE54 pKa = 4.45LVKK57 pKa = 10.59GLKK60 pKa = 9.63PFHH63 pKa = 6.96HH64 pKa = 6.74EE65 pKa = 4.01LGG67 pKa = 3.82
Molecular weight: 7.58 kDa
Isoelectric point according different methods:
Protein with the highest isoelectric point:
>tr|K4N435|K4N435_9VIRU Movement protein TGB2 OS=Rubus canadensis virus 1 OX=1243178 PE=3 SV=1
MM1 pKa = 7.93PLTPPKK7 pKa = 10.13DD8 pKa = 3.66YY9 pKa = 10.41TGAAISVVIGLCIAFAFHH27 pKa = 7.19SLTRR31 pKa = 11.84SNLPHH36 pKa = 6.98AGDD39 pKa = 4.67NIHH42 pKa = 6.71HH43 pKa = 6.87LPHH46 pKa = 6.38GGFYY50 pKa = 10.51KK51 pKa = 10.85DD52 pKa = 3.27GTKK55 pKa = 10.2VVAYY59 pKa = 9.13GGPQSRR65 pKa = 11.84FPSSNLFSSSFSSLSVLCVILLLSGLIYY93 pKa = 10.71ASNKK97 pKa = 9.88FGGGGAGQCVCGSRR111 pKa = 11.84AHH113 pKa = 6.31NNRR116 pKa = 3.4
MM1 pKa = 7.93PLTPPKK7 pKa = 10.13DD8 pKa = 3.66YY9 pKa = 10.41TGAAISVVIGLCIAFAFHH27 pKa = 7.19SLTRR31 pKa = 11.84SNLPHH36 pKa = 6.98AGDD39 pKa = 4.67NIHH42 pKa = 6.71HH43 pKa = 6.87LPHH46 pKa = 6.38GGFYY50 pKa = 10.51KK51 pKa = 10.85DD52 pKa = 3.27GTKK55 pKa = 10.2VVAYY59 pKa = 9.13GGPQSRR65 pKa = 11.84FPSSNLFSSSFSSLSVLCVILLLSGLIYY93 pKa = 10.71ASNKK97 pKa = 9.88FGGGGAGQCVCGSRR111 pKa = 11.84AHH113 pKa = 6.31NNRR116 pKa = 3.4
Molecular weight: 12.11 kDa
Isoelectric point according different methods:
Peptides (in silico digests for buttom-up proteomics)
Below you can find in silico digests of the whole proteome with Trypsin, Chymotrypsin, Trypsin+LysC, LysN, ArgC proteases suitable for different mass spec machines.| Try ESI |
 |
|---|
| ChTry ESI |
|
|---|
| ArgC ESI |
|
|---|
| LysN ESI |
|
|---|
| TryLysC ESI |
|
|---|
| Try MALDI |
|
|---|
| ChTry MALDI |
|
|---|
| ArgC MALDI |
|
|---|
| LysN MALDI |
|
|---|
| TryLysC MALDI |
|
|---|
| Try LTQ |
|
|---|
| ChTry LTQ |
|
|---|
| ArgC LTQ |
|
|---|
| LysN LTQ |
|
|---|
| TryLysC LTQ |
|
|---|
| Try MSlow |
|
|---|
| ChTry MSlow |
|
|---|
| ArgC MSlow |
|
|---|
| LysN MSlow |
|
|---|
| TryLysC MSlow |
|
|---|
| Try MShigh |
|
|---|
| ChTry MShigh |
|
|---|
| ArgC MShigh |
|
|---|
| LysN MShigh |
|
|---|
| TryLysC MShigh |
|
|---|
General Statistics
Number of major isoforms |
Number of additional isoforms |
Number of all proteins |
Number of amino acids |
Min. Seq. Length |
Max. Seq. Length |
Avg. Seq. Length |
Avg. Mol. Weight |
|---|---|---|---|---|---|---|---|
0 |
2721 |
67 |
2038 |
544.2 |
61.4 |
Amino acid frequency
Ala |
Cys |
Asp |
Glu |
Phe |
Gly |
His |
Ile |
Lys |
Leu |
|---|---|---|---|---|---|---|---|---|---|
5.476 ± 1.834 | 2.573 ± 0.177 |
5.072 ± 0.519 | 7.24 ± 1.128 |
6.542 ± 0.783 | 5.954 ± 0.914 |
2.279 ± 0.715 | 5.917 ± 0.56 |
7.313 ± 0.709 | 10.254 ± 0.603 |
Met |
Asn |
Gln |
Pro |
Arg |
Ser |
Thr |
Val |
Trp |
Tyr |
|---|---|---|---|---|---|---|---|---|---|
2.132 ± 0.486 | 4.851 ± 0.236 |
3.602 ± 0.324 | 2.132 ± 0.387 |
4.778 ± 0.463 | 9.482 ± 0.818 |
3.969 ± 0.499 | 6.725 ± 1.005 |
0.992 ± 0.159 | 2.72 ± 0.769 |
Most of the basic statistics you can see at this page can be downloaded from this CSV file
See this proteome in:

Proteome-pI is available under Creative Commons Attribution-NoDerivs license, for more details see here
| Reference: Kozlowski LP. Proteome-pI 2.0: Proteome Isoelectric Point Database Update. Nucleic Acids Res. 2021, doi: 10.1093/nar/gkab944 | Contact: Lukasz P. Kozlowski |