Citreimonas salinaria
Taxonomy: cellular organisms; Bacteria; Proteobacteria; Alphaproteobacteria; Rhodobacterales; Roseobacteraceae; Citreimonas
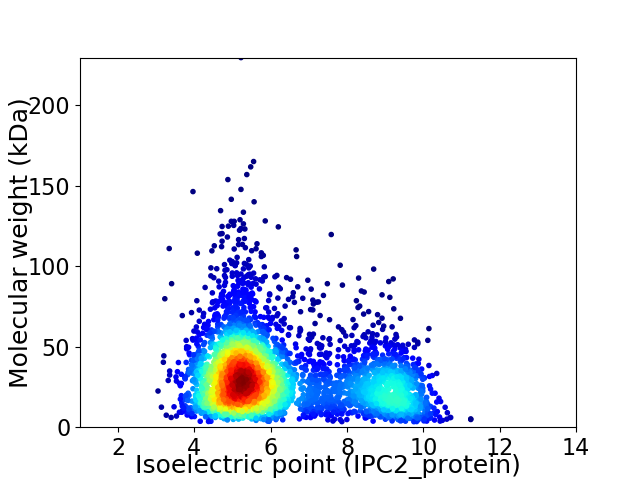
Average proteome isoelectric point is 6.27
Get precalculated fractions of proteins

Virtual 2D-PAGE plot for 4109 proteins (isoelectric point calculated using IPC2_protein)
Get csv file with sequences according to given criteria:
* You can choose from 21 different methods for calculating isoelectric point
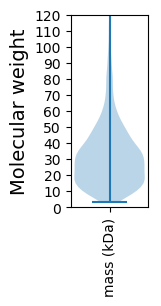
Summary statistics related to proteome-wise predictions


Protein with the lowest isoelectric point:
>tr|A0A1H3M1A7|A0A1H3M1A7_9RHOB Aminobenzoyl-glutamate utilization protein B OS=Citreimonas salinaria OX=321339 GN=SAMN05444340_11548 PE=4 SV=1
MM1 pKa = 7.57KK2 pKa = 10.28SILFATSVLVASAGMASAQYY22 pKa = 11.1VDD24 pKa = 3.6VAGSAEE30 pKa = 3.92VGIVGGEE37 pKa = 3.9RR38 pKa = 11.84YY39 pKa = 7.61GTPSSGGVDD48 pKa = 3.54QIFTDD53 pKa = 3.62IEE55 pKa = 4.66VVFTMTGQTDD65 pKa = 3.01NGLSYY70 pKa = 10.66GASVDD75 pKa = 4.12LDD77 pKa = 3.9EE78 pKa = 7.35GDD80 pKa = 4.98DD81 pKa = 4.2SFDD84 pKa = 3.58GTDD87 pKa = 4.16DD88 pKa = 5.83DD89 pKa = 4.52GATWFLVYY97 pKa = 10.58GDD99 pKa = 4.15YY100 pKa = 10.97RR101 pKa = 11.84LDD103 pKa = 3.7VGDD106 pKa = 3.7TDD108 pKa = 4.19GAFDD112 pKa = 3.72AAVAEE117 pKa = 4.37TSLVGTINDD126 pKa = 3.98TEE128 pKa = 4.08EE129 pKa = 3.93HH130 pKa = 6.22LGYY133 pKa = 10.33SGNSALDD140 pKa = 4.17GIYY143 pKa = 10.41DD144 pKa = 3.72GQIARR149 pKa = 11.84LSRR152 pKa = 11.84SAGSVAGHH160 pKa = 5.88VSVEE164 pKa = 3.87VDD166 pKa = 4.12DD167 pKa = 4.64MGEE170 pKa = 3.93SSPVYY175 pKa = 10.21GVGFTYY181 pKa = 10.43DD182 pKa = 3.05RR183 pKa = 11.84RR184 pKa = 11.84IAGVDD189 pKa = 3.16VRR191 pKa = 11.84VGVGHH196 pKa = 6.08QRR198 pKa = 11.84TVVDD202 pKa = 3.65ADD204 pKa = 4.54DD205 pKa = 4.01YY206 pKa = 11.97GFDD209 pKa = 4.63DD210 pKa = 5.01GLHH213 pKa = 5.14TVAGASVSTSHH224 pKa = 6.69EE225 pKa = 3.91NGLRR229 pKa = 11.84TVASYY234 pKa = 11.5VEE236 pKa = 4.05YY237 pKa = 10.93DD238 pKa = 3.23QANWSKK244 pKa = 9.48TMKK247 pKa = 10.21HH248 pKa = 5.16SAIGVGYY255 pKa = 8.36TRR257 pKa = 11.84DD258 pKa = 3.82ALSVAANYY266 pKa = 10.17GIYY269 pKa = 10.41NDD271 pKa = 3.91FDD273 pKa = 4.37GVDD276 pKa = 3.69GPTSRR281 pKa = 11.84GYY283 pKa = 11.4AFAVNYY289 pKa = 10.17DD290 pKa = 3.56LGGGLVAQAGFSEE303 pKa = 4.67SDD305 pKa = 3.39LKK307 pKa = 11.45VDD309 pKa = 3.93GFEE312 pKa = 4.89HH313 pKa = 7.04EE314 pKa = 4.37GDD316 pKa = 3.65NYY318 pKa = 11.12SLGVAMAFF326 pKa = 3.68
MM1 pKa = 7.57KK2 pKa = 10.28SILFATSVLVASAGMASAQYY22 pKa = 11.1VDD24 pKa = 3.6VAGSAEE30 pKa = 3.92VGIVGGEE37 pKa = 3.9RR38 pKa = 11.84YY39 pKa = 7.61GTPSSGGVDD48 pKa = 3.54QIFTDD53 pKa = 3.62IEE55 pKa = 4.66VVFTMTGQTDD65 pKa = 3.01NGLSYY70 pKa = 10.66GASVDD75 pKa = 4.12LDD77 pKa = 3.9EE78 pKa = 7.35GDD80 pKa = 4.98DD81 pKa = 4.2SFDD84 pKa = 3.58GTDD87 pKa = 4.16DD88 pKa = 5.83DD89 pKa = 4.52GATWFLVYY97 pKa = 10.58GDD99 pKa = 4.15YY100 pKa = 10.97RR101 pKa = 11.84LDD103 pKa = 3.7VGDD106 pKa = 3.7TDD108 pKa = 4.19GAFDD112 pKa = 3.72AAVAEE117 pKa = 4.37TSLVGTINDD126 pKa = 3.98TEE128 pKa = 4.08EE129 pKa = 3.93HH130 pKa = 6.22LGYY133 pKa = 10.33SGNSALDD140 pKa = 4.17GIYY143 pKa = 10.41DD144 pKa = 3.72GQIARR149 pKa = 11.84LSRR152 pKa = 11.84SAGSVAGHH160 pKa = 5.88VSVEE164 pKa = 3.87VDD166 pKa = 4.12DD167 pKa = 4.64MGEE170 pKa = 3.93SSPVYY175 pKa = 10.21GVGFTYY181 pKa = 10.43DD182 pKa = 3.05RR183 pKa = 11.84RR184 pKa = 11.84IAGVDD189 pKa = 3.16VRR191 pKa = 11.84VGVGHH196 pKa = 6.08QRR198 pKa = 11.84TVVDD202 pKa = 3.65ADD204 pKa = 4.54DD205 pKa = 4.01YY206 pKa = 11.97GFDD209 pKa = 4.63DD210 pKa = 5.01GLHH213 pKa = 5.14TVAGASVSTSHH224 pKa = 6.69EE225 pKa = 3.91NGLRR229 pKa = 11.84TVASYY234 pKa = 11.5VEE236 pKa = 4.05YY237 pKa = 10.93DD238 pKa = 3.23QANWSKK244 pKa = 9.48TMKK247 pKa = 10.21HH248 pKa = 5.16SAIGVGYY255 pKa = 8.36TRR257 pKa = 11.84DD258 pKa = 3.82ALSVAANYY266 pKa = 10.17GIYY269 pKa = 10.41NDD271 pKa = 3.91FDD273 pKa = 4.37GVDD276 pKa = 3.69GPTSRR281 pKa = 11.84GYY283 pKa = 11.4AFAVNYY289 pKa = 10.17DD290 pKa = 3.56LGGGLVAQAGFSEE303 pKa = 4.67SDD305 pKa = 3.39LKK307 pKa = 11.45VDD309 pKa = 3.93GFEE312 pKa = 4.89HH313 pKa = 7.04EE314 pKa = 4.37GDD316 pKa = 3.65NYY318 pKa = 11.12SLGVAMAFF326 pKa = 3.68
Molecular weight: 34.0 kDa
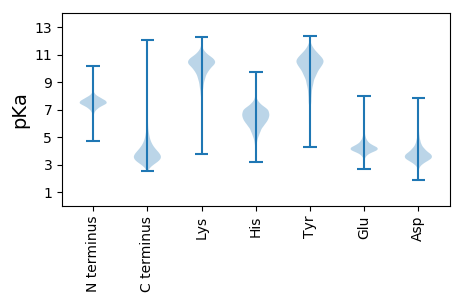
Isoelectric point according different methods:
Protein with the highest isoelectric point:
>tr|A0A1H3KPV1|A0A1H3KPV1_9RHOB dCTP deaminase OS=Citreimonas salinaria OX=321339 GN=SAMN05444340_11037 PE=4 SV=1
MM1 pKa = 7.45KK2 pKa = 9.61RR3 pKa = 11.84TFQPSNLVRR12 pKa = 11.84KK13 pKa = 9.18RR14 pKa = 11.84RR15 pKa = 11.84HH16 pKa = 4.42GFRR19 pKa = 11.84ARR21 pKa = 11.84MATKK25 pKa = 10.37AGRR28 pKa = 11.84KK29 pKa = 8.54ILNARR34 pKa = 11.84RR35 pKa = 11.84ARR37 pKa = 11.84GRR39 pKa = 11.84KK40 pKa = 9.07SLSAA44 pKa = 3.93
MM1 pKa = 7.45KK2 pKa = 9.61RR3 pKa = 11.84TFQPSNLVRR12 pKa = 11.84KK13 pKa = 9.18RR14 pKa = 11.84RR15 pKa = 11.84HH16 pKa = 4.42GFRR19 pKa = 11.84ARR21 pKa = 11.84MATKK25 pKa = 10.37AGRR28 pKa = 11.84KK29 pKa = 8.54ILNARR34 pKa = 11.84RR35 pKa = 11.84ARR37 pKa = 11.84GRR39 pKa = 11.84KK40 pKa = 9.07SLSAA44 pKa = 3.93
Molecular weight: 5.14 kDa
Isoelectric point according different methods:
Peptides (in silico digests for buttom-up proteomics)
Below you can find in silico digests of the whole proteome with Trypsin, Chymotrypsin, Trypsin+LysC, LysN, ArgC proteases suitable for different mass spec machines.| Try ESI |
 |
|---|
| ChTry ESI |
 |
|---|
| ArgC ESI |
 |
|---|
| LysN ESI |
 |
|---|
| TryLysC ESI |
 |
|---|
| Try MALDI |
 |
|---|
| ChTry MALDI |
 |
|---|
| ArgC MALDI |
 |
|---|
| LysN MALDI |
 |
|---|
| TryLysC MALDI |
 |
|---|
| Try LTQ |
 |
|---|
| ChTry LTQ |
 |
|---|
| ArgC LTQ |
 |
|---|
| LysN LTQ |
 |
|---|
| TryLysC LTQ |
 |
|---|
| Try MSlow |
 |
|---|
| ChTry MSlow |
 |
|---|
| ArgC MSlow |
 |
|---|
| LysN MSlow |
 |
|---|
| TryLysC MSlow |
 |
|---|
| Try MShigh |
 |
|---|
| ChTry MShigh |
 |
|---|
| ArgC MShigh |
 |
|---|
| LysN MShigh |
 |
|---|
| TryLysC MShigh |
 |
|---|
General Statistics
Number of major isoforms |
Number of additional isoforms |
Number of all proteins |
Number of amino acids |
Min. Seq. Length |
Max. Seq. Length |
Avg. Seq. Length |
Avg. Mol. Weight |
|---|---|---|---|---|---|---|---|
0 |
1253694 |
30 |
2143 |
305.1 |
33.07 |
Amino acid frequency
Ala |
Cys |
Asp |
Glu |
Phe |
Gly |
His |
Ile |
Lys |
Leu |
|---|---|---|---|---|---|---|---|---|---|
13.073 ± 0.057 | 0.862 ± 0.012 |
6.299 ± 0.034 | 5.981 ± 0.037 |
3.559 ± 0.024 | 8.785 ± 0.039 |
2.108 ± 0.018 | 4.807 ± 0.029 |
2.583 ± 0.03 | 10.078 ± 0.053 |
Met |
Asn |
Gln |
Pro |
Arg |
Ser |
Thr |
Val |
Trp |
Tyr |
|---|---|---|---|---|---|---|---|---|---|
2.707 ± 0.017 | 2.227 ± 0.023 |
5.258 ± 0.025 | 2.991 ± 0.019 |
7.588 ± 0.04 | 4.864 ± 0.026 |
5.343 ± 0.024 | 7.395 ± 0.036 |
1.425 ± 0.017 | 2.066 ± 0.02 |
Most of the basic statistics you can see at this page can be downloaded from this CSV file
Proteome-pI is available under Creative Commons Attribution-NoDerivs license, for more details see here
| Reference: Kozlowski LP. Proteome-pI 2.0: Proteome Isoelectric Point Database Update. Nucleic Acids Res. 2021, doi: 10.1093/nar/gkab944 | Contact: Lukasz P. Kozlowski |
