Weissella cibaria
Taxonomy: cellular organisms; Bacteria; Terrabacteria group;
Average proteome isoelectric point is 6.26
Get precalculated fractions of proteins

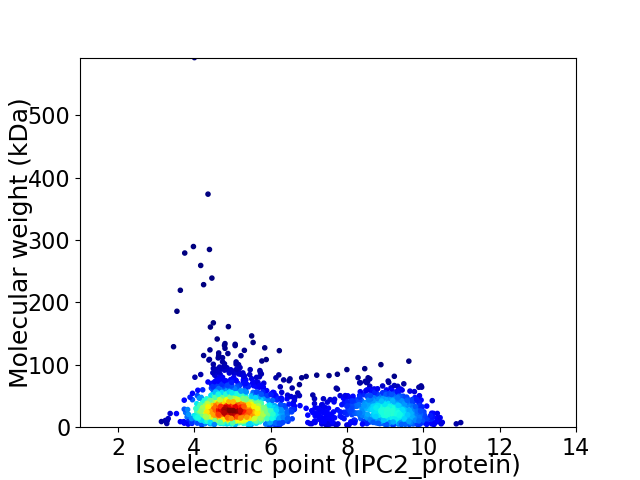
Virtual 2D-PAGE plot for 2282 proteins (isoelectric point calculated using IPC2_protein)
Get csv file with sequences according to given criteria:
* You can choose from 21 different methods for calculating isoelectric point
Summary statistics related to proteome-wise predictions


Protein with the lowest isoelectric point:
>tr|A0A0D1JFW6|A0A0D1JFW6_9LACO WxL domain-containing protein OS=Weissella cibaria OX=137591 GN=QX99_01348 PE=4 SV=1
MM1 pKa = 7.09TGIVAKK7 pKa = 10.62DD8 pKa = 3.25ADD10 pKa = 3.63ATITVVYY17 pKa = 10.04NQMGQWVPSFPAGTTDD33 pKa = 3.58VPSDD37 pKa = 3.2PMTYY41 pKa = 10.4PNDD44 pKa = 3.61PTDD47 pKa = 3.63PTEE50 pKa = 4.21PLAPGPEE57 pKa = 4.09NEE59 pKa = 4.9NDD61 pKa = 3.76PGDD64 pKa = 4.11PANPTLPYY72 pKa = 10.56VPGFTPQGPDD82 pKa = 3.26GPLQPVDD89 pKa = 3.72PANPSSGYY97 pKa = 9.26WPPTLPSDD105 pKa = 3.59PTTDD109 pKa = 3.1TTITYY114 pKa = 8.05TADD117 pKa = 3.36EE118 pKa = 4.2QVATITYY125 pKa = 9.43IDD127 pKa = 3.71AVTNEE132 pKa = 4.11TLGVDD137 pKa = 4.27RR138 pKa = 11.84IKK140 pKa = 11.16GGSDD144 pKa = 2.98EE145 pKa = 4.24SHH147 pKa = 7.25AYY149 pKa = 5.76TTADD153 pKa = 3.27RR154 pKa = 11.84LAAYY158 pKa = 9.27LVSGYY163 pKa = 10.29EE164 pKa = 4.17LVSDD168 pKa = 5.05GYY170 pKa = 8.65PTNFTFDD177 pKa = 3.41RR178 pKa = 11.84DD179 pKa = 4.05TTVTQAYY186 pKa = 6.87TVTLTHH192 pKa = 7.21GSQTINPNDD201 pKa = 4.04PKK203 pKa = 11.15TPGTPINPDD212 pKa = 3.25NPDD215 pKa = 3.21GPKK218 pKa = 10.7YY219 pKa = 10.16PDD221 pKa = 3.57GLQATDD227 pKa = 3.98LNEE230 pKa = 4.23SVTRR234 pKa = 11.84TITYY238 pKa = 9.93VDD240 pKa = 3.43QAGKK244 pKa = 8.91TMATAVKK251 pKa = 8.64EE252 pKa = 4.48TIHH255 pKa = 5.58FTRR258 pKa = 11.84TATLDD263 pKa = 3.88TVTGAYY269 pKa = 8.02TYY271 pKa = 10.42SAWEE275 pKa = 4.12PTTVTSMDD283 pKa = 3.55AVDD286 pKa = 4.03SPVIAGYY293 pKa = 10.12VADD296 pKa = 4.67RR297 pKa = 11.84QTVAALSDD305 pKa = 3.78LTATSADD312 pKa = 3.29MSEE315 pKa = 4.1KK316 pKa = 10.47VVYY319 pKa = 10.46SPIGQYY325 pKa = 10.49VPAFPSGVTDD335 pKa = 3.87VPSTPIDD342 pKa = 3.76YY343 pKa = 9.57PNNPDD348 pKa = 5.3DD349 pKa = 4.33PTTTDD354 pKa = 3.55TPGEE358 pKa = 4.36DD359 pKa = 3.45NPATSGTPDD368 pKa = 4.19NPTMPYY374 pKa = 10.3VPGFTPQGPDD384 pKa = 3.26GPLQPVDD391 pKa = 3.51PRR393 pKa = 11.84QPKK396 pKa = 9.88CRR398 pKa = 11.84LLATSAKK405 pKa = 9.9RR406 pKa = 11.84DD407 pKa = 3.65ANN409 pKa = 3.65
MM1 pKa = 7.09TGIVAKK7 pKa = 10.62DD8 pKa = 3.25ADD10 pKa = 3.63ATITVVYY17 pKa = 10.04NQMGQWVPSFPAGTTDD33 pKa = 3.58VPSDD37 pKa = 3.2PMTYY41 pKa = 10.4PNDD44 pKa = 3.61PTDD47 pKa = 3.63PTEE50 pKa = 4.21PLAPGPEE57 pKa = 4.09NEE59 pKa = 4.9NDD61 pKa = 3.76PGDD64 pKa = 4.11PANPTLPYY72 pKa = 10.56VPGFTPQGPDD82 pKa = 3.26GPLQPVDD89 pKa = 3.72PANPSSGYY97 pKa = 9.26WPPTLPSDD105 pKa = 3.59PTTDD109 pKa = 3.1TTITYY114 pKa = 8.05TADD117 pKa = 3.36EE118 pKa = 4.2QVATITYY125 pKa = 9.43IDD127 pKa = 3.71AVTNEE132 pKa = 4.11TLGVDD137 pKa = 4.27RR138 pKa = 11.84IKK140 pKa = 11.16GGSDD144 pKa = 2.98EE145 pKa = 4.24SHH147 pKa = 7.25AYY149 pKa = 5.76TTADD153 pKa = 3.27RR154 pKa = 11.84LAAYY158 pKa = 9.27LVSGYY163 pKa = 10.29EE164 pKa = 4.17LVSDD168 pKa = 5.05GYY170 pKa = 8.65PTNFTFDD177 pKa = 3.41RR178 pKa = 11.84DD179 pKa = 4.05TTVTQAYY186 pKa = 6.87TVTLTHH192 pKa = 7.21GSQTINPNDD201 pKa = 4.04PKK203 pKa = 11.15TPGTPINPDD212 pKa = 3.25NPDD215 pKa = 3.21GPKK218 pKa = 10.7YY219 pKa = 10.16PDD221 pKa = 3.57GLQATDD227 pKa = 3.98LNEE230 pKa = 4.23SVTRR234 pKa = 11.84TITYY238 pKa = 9.93VDD240 pKa = 3.43QAGKK244 pKa = 8.91TMATAVKK251 pKa = 8.64EE252 pKa = 4.48TIHH255 pKa = 5.58FTRR258 pKa = 11.84TATLDD263 pKa = 3.88TVTGAYY269 pKa = 8.02TYY271 pKa = 10.42SAWEE275 pKa = 4.12PTTVTSMDD283 pKa = 3.55AVDD286 pKa = 4.03SPVIAGYY293 pKa = 10.12VADD296 pKa = 4.67RR297 pKa = 11.84QTVAALSDD305 pKa = 3.78LTATSADD312 pKa = 3.29MSEE315 pKa = 4.1KK316 pKa = 10.47VVYY319 pKa = 10.46SPIGQYY325 pKa = 10.49VPAFPSGVTDD335 pKa = 3.87VPSTPIDD342 pKa = 3.76YY343 pKa = 9.57PNNPDD348 pKa = 5.3DD349 pKa = 4.33PTTTDD354 pKa = 3.55TPGEE358 pKa = 4.36DD359 pKa = 3.45NPATSGTPDD368 pKa = 4.19NPTMPYY374 pKa = 10.3VPGFTPQGPDD384 pKa = 3.26GPLQPVDD391 pKa = 3.51PRR393 pKa = 11.84QPKK396 pKa = 9.88CRR398 pKa = 11.84LLATSAKK405 pKa = 9.9RR406 pKa = 11.84DD407 pKa = 3.65ANN409 pKa = 3.65
Molecular weight: 43.3 kDa
Isoelectric point according different methods:
Protein with the highest isoelectric point:
>tr|A0A0D1M103|A0A0D1M103_9LACO Multidrug resistance protein SMR OS=Weissella cibaria OX=137591 GN=ykkC_2 PE=3 SV=1
MM1 pKa = 7.36KK2 pKa = 9.43RR3 pKa = 11.84TYY5 pKa = 9.69QPKK8 pKa = 8.34KK9 pKa = 7.47RR10 pKa = 11.84HH11 pKa = 5.71RR12 pKa = 11.84EE13 pKa = 3.7RR14 pKa = 11.84VHH16 pKa = 6.23GFRR19 pKa = 11.84KK20 pKa = 10.04RR21 pKa = 11.84MSTSNGRR28 pKa = 11.84KK29 pKa = 8.01VLARR33 pKa = 11.84RR34 pKa = 11.84RR35 pKa = 11.84QKK37 pKa = 10.39GRR39 pKa = 11.84KK40 pKa = 8.52VLSAA44 pKa = 4.05
MM1 pKa = 7.36KK2 pKa = 9.43RR3 pKa = 11.84TYY5 pKa = 9.69QPKK8 pKa = 8.34KK9 pKa = 7.47RR10 pKa = 11.84HH11 pKa = 5.71RR12 pKa = 11.84EE13 pKa = 3.7RR14 pKa = 11.84VHH16 pKa = 6.23GFRR19 pKa = 11.84KK20 pKa = 10.04RR21 pKa = 11.84MSTSNGRR28 pKa = 11.84KK29 pKa = 8.01VLARR33 pKa = 11.84RR34 pKa = 11.84RR35 pKa = 11.84QKK37 pKa = 10.39GRR39 pKa = 11.84KK40 pKa = 8.52VLSAA44 pKa = 4.05
Molecular weight: 5.38 kDa
Isoelectric point according different methods:
Peptides (in silico digests for buttom-up proteomics)
Below you can find in silico digests of the whole proteome with Trypsin, Chymotrypsin, Trypsin+LysC, LysN, ArgC proteases suitable for different mass spec machines.| Try ESI |
 |
|---|
| ChTry ESI |
 |
|---|
| ArgC ESI |
 |
|---|
| LysN ESI |
 |
|---|
| TryLysC ESI |
 |
|---|
| Try MALDI |
 |
|---|
| ChTry MALDI |
 |
|---|
| ArgC MALDI |
 |
|---|
| LysN MALDI |
 |
|---|
| TryLysC MALDI |
 |
|---|
| Try LTQ |
 |
|---|
| ChTry LTQ |
 |
|---|
| ArgC LTQ |
 |
|---|
| LysN LTQ |
 |
|---|
| TryLysC LTQ |
 |
|---|
| Try MSlow |
 |
|---|
| ChTry MSlow |
 |
|---|
| ArgC MSlow |
 |
|---|
| LysN MSlow |
 |
|---|
| TryLysC MSlow |
 |
|---|
| Try MShigh |
 |
|---|
| ChTry MShigh |
 |
|---|
| ArgC MShigh |
 |
|---|
| LysN MShigh |
 |
|---|
| TryLysC MShigh |
 |
|---|
General Statistics
Number of major isoforms |
Number of additional isoforms |
Number of all proteins |
Number of amino acids |
Min. Seq. Length |
Max. Seq. Length |
Avg. Seq. Length |
Avg. Mol. Weight |
|---|---|---|---|---|---|---|---|
0 |
699463 |
29 |
5706 |
306.5 |
33.76 |
Amino acid frequency
Ala |
Cys |
Asp |
Glu |
Phe |
Gly |
His |
Ile |
Lys |
Leu |
|---|---|---|---|---|---|---|---|---|---|
10.204 ± 0.126 | 0.124 ± 0.007 |
6.152 ± 0.071 | 5.314 ± 0.07 |
4.067 ± 0.057 | 6.96 ± 0.061 |
1.904 ± 0.031 | 6.116 ± 0.06 |
5.009 ± 0.059 | 9.416 ± 0.083 |
Met |
Asn |
Gln |
Pro |
Arg |
Ser |
Thr |
Val |
Trp |
Tyr |
|---|---|---|---|---|---|---|---|---|---|
2.959 ± 0.039 | 4.334 ± 0.039 |
3.657 ± 0.038 | 4.532 ± 0.047 |
4.205 ± 0.064 | 5.422 ± 0.063 |
7.115 ± 0.106 | 8.04 ± 0.044 |
1.172 ± 0.024 | 3.297 ± 0.037 |
Most of the basic statistics you can see at this page can be downloaded from this CSV file
Proteome-pI is available under Creative Commons Attribution-NoDerivs license, for more details see here
| Reference: Kozlowski LP. Proteome-pI 2.0: Proteome Isoelectric Point Database Update. Nucleic Acids Res. 2021, doi: 10.1093/nar/gkab944 | Contact: Lukasz P. Kozlowski |
