Mungbean yellow mosaic India virus
Taxonomy: Viruses; Monodnaviria; Shotokuvirae; Cressdnaviricota; Repensiviricetes; Geplafuvirales; Geminiviridae; Begomovirus
Average proteome isoelectric point is 8.14
Get precalculated fractions of proteins

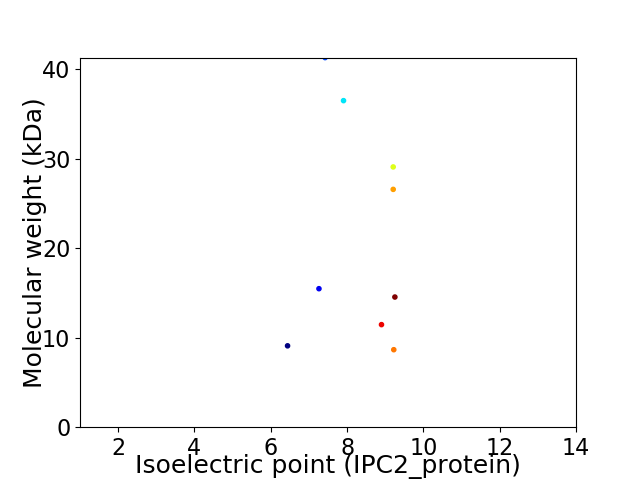
Virtual 2D-PAGE plot for 9 proteins (isoelectric point calculated using IPC2_protein)
Get csv file with sequences according to given criteria:
* You can choose from 21 different methods for calculating isoelectric point
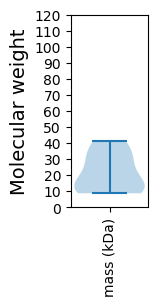
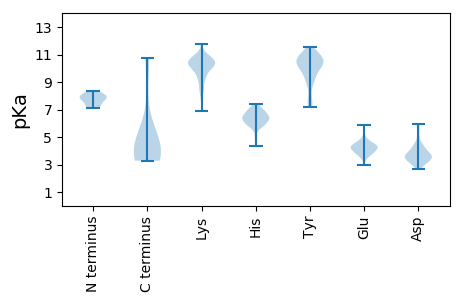
Summary statistics related to proteome-wise predictions


Protein with the lowest isoelectric point:
>tr|Q9WH22|Q9WH22_9GEMI Replication enhancer OS=Mungbean yellow mosaic India virus OX=223287 GN=AC3 PE=3 SV=1
MM1 pKa = 7.9VLILRR6 pKa = 11.84CLLVVVNNIIINLEE20 pKa = 3.94EE21 pKa = 4.52TIHH24 pKa = 6.49HH25 pKa = 6.32GLFFTSILATSNSGTKK41 pKa = 10.6LSQDD45 pKa = 5.05LITITQIVLHH55 pKa = 6.29SGCTGLVVIHH65 pKa = 6.08VEE67 pKa = 4.18HH68 pKa = 6.44LTKK71 pKa = 10.39IHH73 pKa = 6.9GCTKK77 pKa = 9.34WSSVTTT83 pKa = 4.04
MM1 pKa = 7.9VLILRR6 pKa = 11.84CLLVVVNNIIINLEE20 pKa = 3.94EE21 pKa = 4.52TIHH24 pKa = 6.49HH25 pKa = 6.32GLFFTSILATSNSGTKK41 pKa = 10.6LSQDD45 pKa = 5.05LITITQIVLHH55 pKa = 6.29SGCTGLVVIHH65 pKa = 6.08VEE67 pKa = 4.18HH68 pKa = 6.44LTKK71 pKa = 10.39IHH73 pKa = 6.9GCTKK77 pKa = 9.34WSSVTTT83 pKa = 4.04
Molecular weight: 9.09 kDa
Isoelectric point according different methods:
Protein with the highest isoelectric point:
>tr|Q9WH23|Q9WH23_9GEMI Transcriptional activator protein OS=Mungbean yellow mosaic India virus OX=223287 GN=AC2 PE=3 SV=1
MM1 pKa = 8.31DD2 pKa = 4.43FRR4 pKa = 11.84TGEE7 pKa = 4.37NITAAQLRR15 pKa = 11.84SGVYY19 pKa = 8.64IWEE22 pKa = 4.28VQNPLSFKK30 pKa = 10.41IMHH33 pKa = 6.97HH34 pKa = 5.82SPILAEE40 pKa = 4.06SRR42 pKa = 11.84MNGHH46 pKa = 5.91QAAHH50 pKa = 6.08MFNHH54 pKa = 6.73RR55 pKa = 11.84LKK57 pKa = 10.64KK58 pKa = 10.07ALGMHH63 pKa = 6.58KK64 pKa = 10.4CFLDD68 pKa = 3.52LKK70 pKa = 9.75LYY72 pKa = 10.47HH73 pKa = 6.52YY74 pKa = 9.28MKK76 pKa = 9.56ATSGMILSIFRR87 pKa = 11.84NQLFKK92 pKa = 10.9FLNNLGVISLANILYY107 pKa = 8.86FASDD111 pKa = 3.3FLYY114 pKa = 11.11NKK116 pKa = 8.86TPLGGGCKK124 pKa = 10.2LYY126 pKa = 11.07AA127 pKa = 4.49
MM1 pKa = 8.31DD2 pKa = 4.43FRR4 pKa = 11.84TGEE7 pKa = 4.37NITAAQLRR15 pKa = 11.84SGVYY19 pKa = 8.64IWEE22 pKa = 4.28VQNPLSFKK30 pKa = 10.41IMHH33 pKa = 6.97HH34 pKa = 5.82SPILAEE40 pKa = 4.06SRR42 pKa = 11.84MNGHH46 pKa = 5.91QAAHH50 pKa = 6.08MFNHH54 pKa = 6.73RR55 pKa = 11.84LKK57 pKa = 10.64KK58 pKa = 10.07ALGMHH63 pKa = 6.58KK64 pKa = 10.4CFLDD68 pKa = 3.52LKK70 pKa = 9.75LYY72 pKa = 10.47HH73 pKa = 6.52YY74 pKa = 9.28MKK76 pKa = 9.56ATSGMILSIFRR87 pKa = 11.84NQLFKK92 pKa = 10.9FLNNLGVISLANILYY107 pKa = 8.86FASDD111 pKa = 3.3FLYY114 pKa = 11.11NKK116 pKa = 8.86TPLGGGCKK124 pKa = 10.2LYY126 pKa = 11.07AA127 pKa = 4.49
Molecular weight: 14.54 kDa
Isoelectric point according different methods:
Peptides (in silico digests for buttom-up proteomics)
Below you can find in silico digests of the whole proteome with Trypsin, Chymotrypsin, Trypsin+LysC, LysN, ArgC proteases suitable for different mass spec machines.| Try ESI |
 |
|---|
| ChTry ESI |
 |
|---|
| ArgC ESI |
 |
|---|
| LysN ESI |
 |
|---|
| TryLysC ESI |
 |
|---|
| Try MALDI |
 |
|---|
| ChTry MALDI |
 |
|---|
| ArgC MALDI |
 |
|---|
| LysN MALDI |
 |
|---|
| TryLysC MALDI |
 |
|---|
| Try LTQ |
 |
|---|
| ChTry LTQ |
 |
|---|
| ArgC LTQ |
 |
|---|
| LysN LTQ |
 |
|---|
| TryLysC LTQ |
 |
|---|
| Try MSlow |
 |
|---|
| ChTry MSlow |
 |
|---|
| ArgC MSlow |
 |
|---|
| LysN MSlow |
 |
|---|
| TryLysC MSlow |
 |
|---|
| Try MShigh |
 |
|---|
| ChTry MShigh |
 |
|---|
| ArgC MShigh |
 |
|---|
| LysN MShigh |
 |
|---|
| TryLysC MShigh |
 |
|---|
General Statistics
Number of major isoforms |
Number of additional isoforms |
Number of all proteins |
Number of amino acids |
Min. Seq. Length |
Max. Seq. Length |
Avg. Seq. Length |
Avg. Mol. Weight |
|---|---|---|---|---|---|---|---|
0 |
1686 |
74 |
361 |
187.3 |
21.4 |
Amino acid frequency
Ala |
Cys |
Asp |
Glu |
Phe |
Gly |
His |
Ile |
Lys |
Leu |
|---|---|---|---|---|---|---|---|---|---|
5.219 ± 0.619 | 2.372 ± 0.284 |
4.686 ± 0.357 | 4.567 ± 0.512 |
4.389 ± 0.408 | 5.397 ± 0.509 |
3.321 ± 0.482 | 6.287 ± 0.806 |
6.88 ± 0.466 | 8.66 ± 0.905 |
Met |
Asn |
Gln |
Pro |
Arg |
Ser |
Thr |
Val |
Trp |
Tyr |
|---|---|---|---|---|---|---|---|---|---|
2.669 ± 0.515 | 6.05 ± 0.359 |
5.279 ± 0.457 | 3.796 ± 0.321 |
6.109 ± 0.455 | 8.363 ± 0.759 |
5.635 ± 0.664 | 4.923 ± 0.652 |
1.246 ± 0.12 | 4.152 ± 0.397 |
Most of the basic statistics you can see at this page can be downloaded from this CSV file
Proteome-pI is available under Creative Commons Attribution-NoDerivs license, for more details see here
| Reference: Kozlowski LP. Proteome-pI 2.0: Proteome Isoelectric Point Database Update. Nucleic Acids Res. 2021, doi: 10.1093/nar/gkab944 | Contact: Lukasz P. Kozlowski |
