Pseudogymnoascus sp. VKM F-4513 (FW-928)
Taxonomy: cellular organisms; Eukaryota; Opisthokonta; Fungi; Dikarya; Ascomycota; saccharomyceta; Pezizomycotina; leotiomyceta; sordariomyceta; Leotiomycetes; Leotiomycetes incertae sedis; Pseudeurotiaceae; Pseudogymnoascus; unclassified Pseudogymnoascus
Average proteome isoelectric point is 6.31
Get precalculated fractions of proteins

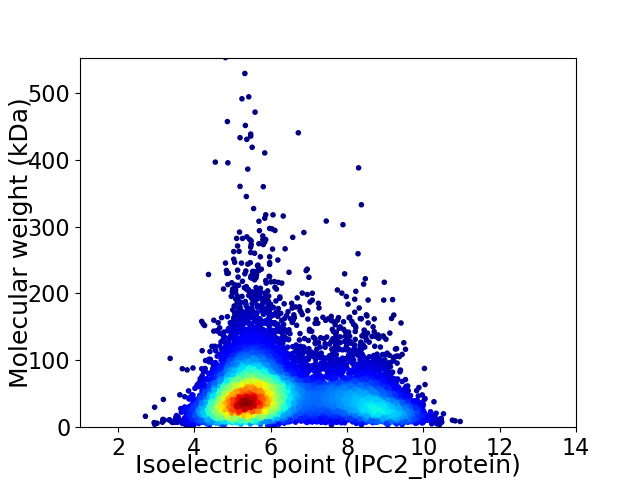
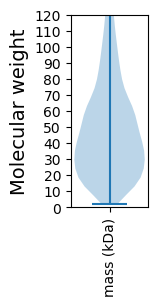
Virtual 2D-PAGE plot for 8667 proteins (isoelectric point calculated using IPC2_protein)
Get csv file with sequences according to given criteria:
* You can choose from 21 different methods for calculating isoelectric point
Summary statistics related to proteome-wise predictions


Protein with the lowest isoelectric point:
>tr|A0A094BP41|A0A094BP41_9PEZI Chorismate mutase OS=Pseudogymnoascus sp. VKM F-4513 (FW-928) OX=1420907 GN=V494_01924 PE=4 SV=1
MM1 pKa = 7.62RR2 pKa = 11.84SSVLVLASVVGVALAQKK19 pKa = 10.75ASDD22 pKa = 3.87CSDD25 pKa = 3.41PQKK28 pKa = 11.24AEE30 pKa = 3.98SCVLKK35 pKa = 9.47LTKK38 pKa = 10.38AGLSCQTVLGIKK50 pKa = 9.54SCYY53 pKa = 10.36DD54 pKa = 3.43DD55 pKa = 4.34FCPEE59 pKa = 3.74IPLPDD64 pKa = 4.83EE65 pKa = 4.26INSIIDD71 pKa = 3.27TCEE74 pKa = 3.7NGGTFPGSGSGSGSGSGSGSGTGSGTGSEE103 pKa = 4.46SGTTTSSASQSTSSTNIEE121 pKa = 4.27SDD123 pKa = 3.66CTDD126 pKa = 3.35ADD128 pKa = 3.83AFSDD132 pKa = 4.21CVKK135 pKa = 10.42PLVKK139 pKa = 10.24VDD141 pKa = 3.79TTCKK145 pKa = 9.37VTMQIQQCFKK155 pKa = 9.96TYY157 pKa = 10.26CPQNIDD163 pKa = 4.43RR164 pKa = 11.84IADD167 pKa = 3.77DD168 pKa = 3.59VASCQGSEE176 pKa = 4.08NGSGTGSDD184 pKa = 4.46DD185 pKa = 4.52DD186 pKa = 4.09STPTSSSDD194 pKa = 3.27DD195 pKa = 3.78SEE197 pKa = 4.55GTGISGGGSSTDD209 pKa = 3.28TSSSADD215 pKa = 3.43STGTGVDD222 pKa = 3.26SGSDD226 pKa = 3.53NTSSSSDD233 pKa = 3.35PTNTSTNSDD242 pKa = 3.32PVATDD247 pKa = 3.22NNVNEE252 pKa = 4.37GAGDD256 pKa = 3.84KK257 pKa = 10.9LFAPAGAIIGSIIAVMAWLL276 pKa = 3.98
MM1 pKa = 7.62RR2 pKa = 11.84SSVLVLASVVGVALAQKK19 pKa = 10.75ASDD22 pKa = 3.87CSDD25 pKa = 3.41PQKK28 pKa = 11.24AEE30 pKa = 3.98SCVLKK35 pKa = 9.47LTKK38 pKa = 10.38AGLSCQTVLGIKK50 pKa = 9.54SCYY53 pKa = 10.36DD54 pKa = 3.43DD55 pKa = 4.34FCPEE59 pKa = 3.74IPLPDD64 pKa = 4.83EE65 pKa = 4.26INSIIDD71 pKa = 3.27TCEE74 pKa = 3.7NGGTFPGSGSGSGSGSGSGSGTGSGTGSEE103 pKa = 4.46SGTTTSSASQSTSSTNIEE121 pKa = 4.27SDD123 pKa = 3.66CTDD126 pKa = 3.35ADD128 pKa = 3.83AFSDD132 pKa = 4.21CVKK135 pKa = 10.42PLVKK139 pKa = 10.24VDD141 pKa = 3.79TTCKK145 pKa = 9.37VTMQIQQCFKK155 pKa = 9.96TYY157 pKa = 10.26CPQNIDD163 pKa = 4.43RR164 pKa = 11.84IADD167 pKa = 3.77DD168 pKa = 3.59VASCQGSEE176 pKa = 4.08NGSGTGSDD184 pKa = 4.46DD185 pKa = 4.52DD186 pKa = 4.09STPTSSSDD194 pKa = 3.27DD195 pKa = 3.78SEE197 pKa = 4.55GTGISGGGSSTDD209 pKa = 3.28TSSSADD215 pKa = 3.43STGTGVDD222 pKa = 3.26SGSDD226 pKa = 3.53NTSSSSDD233 pKa = 3.35PTNTSTNSDD242 pKa = 3.32PVATDD247 pKa = 3.22NNVNEE252 pKa = 4.37GAGDD256 pKa = 3.84KK257 pKa = 10.9LFAPAGAIIGSIIAVMAWLL276 pKa = 3.98
Molecular weight: 27.35 kDa
Isoelectric point according different methods:
Protein with the highest isoelectric point:
>tr|A0A094BQ96|A0A094BQ96_9PEZI Uncharacterized protein OS=Pseudogymnoascus sp. VKM F-4513 (FW-928) OX=1420907 GN=V494_01724 PE=4 SV=1
MM1 pKa = 7.61PPSAMPHH8 pKa = 6.21HH9 pKa = 6.79AHH11 pKa = 6.56APSPTSHH18 pKa = 7.22AATTAAAAATSSATRR33 pKa = 11.84TPRR36 pKa = 11.84TSSRR40 pKa = 11.84STKK43 pKa = 8.22TPRR46 pKa = 11.84STLSDD51 pKa = 3.28TAAALANSAGASTKK65 pKa = 10.34GGKK68 pKa = 8.89SRR70 pKa = 11.84AARR73 pKa = 11.84APAAATAATARR84 pKa = 11.84RR85 pKa = 11.84AAGMAAVAPAGARR98 pKa = 11.84MGVRR102 pKa = 11.84ACPRR106 pKa = 11.84RR107 pKa = 11.84RR108 pKa = 3.29
MM1 pKa = 7.61PPSAMPHH8 pKa = 6.21HH9 pKa = 6.79AHH11 pKa = 6.56APSPTSHH18 pKa = 7.22AATTAAAAATSSATRR33 pKa = 11.84TPRR36 pKa = 11.84TSSRR40 pKa = 11.84STKK43 pKa = 8.22TPRR46 pKa = 11.84STLSDD51 pKa = 3.28TAAALANSAGASTKK65 pKa = 10.34GGKK68 pKa = 8.89SRR70 pKa = 11.84AARR73 pKa = 11.84APAAATAATARR84 pKa = 11.84RR85 pKa = 11.84AAGMAAVAPAGARR98 pKa = 11.84MGVRR102 pKa = 11.84ACPRR106 pKa = 11.84RR107 pKa = 11.84RR108 pKa = 3.29
Molecular weight: 10.54 kDa
Isoelectric point according different methods:
Peptides (in silico digests for buttom-up proteomics)
Below you can find in silico digests of the whole proteome with Trypsin, Chymotrypsin, Trypsin+LysC, LysN, ArgC proteases suitable for different mass spec machines.| Try ESI |
 |
|---|
| ChTry ESI |
 |
|---|
| ArgC ESI |
 |
|---|
| LysN ESI |
 |
|---|
| TryLysC ESI |
 |
|---|
| Try MALDI |
 |
|---|
| ChTry MALDI |
 |
|---|
| ArgC MALDI |
 |
|---|
| LysN MALDI |
 |
|---|
| TryLysC MALDI |
 |
|---|
| Try LTQ |
 |
|---|
| ChTry LTQ |
 |
|---|
| ArgC LTQ |
 |
|---|
| LysN LTQ |
 |
|---|
| TryLysC LTQ |
 |
|---|
| Try MSlow |
 |
|---|
| ChTry MSlow |
 |
|---|
| ArgC MSlow |
 |
|---|
| LysN MSlow |
 |
|---|
| TryLysC MSlow |
 |
|---|
| Try MShigh |
 |
|---|
| ChTry MShigh |
 |
|---|
| ArgC MShigh |
 |
|---|
| LysN MShigh |
 |
|---|
| TryLysC MShigh |
 |
|---|
General Statistics
Number of major isoforms |
Number of additional isoforms |
Number of all proteins |
Number of amino acids |
Min. Seq. Length |
Max. Seq. Length |
Avg. Seq. Length |
Avg. Mol. Weight |
|---|---|---|---|---|---|---|---|
0 |
4433224 |
17 |
4963 |
511.5 |
56.34 |
Amino acid frequency
Ala |
Cys |
Asp |
Glu |
Phe |
Gly |
His |
Ile |
Lys |
Leu |
|---|---|---|---|---|---|---|---|---|---|
8.947 ± 0.023 | 1.151 ± 0.009 |
5.755 ± 0.02 | 6.411 ± 0.028 |
3.599 ± 0.016 | 7.269 ± 0.026 |
2.214 ± 0.012 | 4.996 ± 0.018 |
5.106 ± 0.024 | 8.674 ± 0.031 |
Met |
Asn |
Gln |
Pro |
Arg |
Ser |
Thr |
Val |
Trp |
Tyr |
|---|---|---|---|---|---|---|---|---|---|
2.153 ± 0.012 | 3.753 ± 0.014 |
5.882 ± 0.028 | 3.839 ± 0.019 |
5.802 ± 0.023 | 8.085 ± 0.028 |
6.013 ± 0.017 | 6.2 ± 0.021 |
1.401 ± 0.009 | 2.75 ± 0.011 |
Most of the basic statistics you can see at this page can be downloaded from this CSV file
Proteome-pI is available under Creative Commons Attribution-NoDerivs license, for more details see here
| Reference: Kozlowski LP. Proteome-pI 2.0: Proteome Isoelectric Point Database Update. Nucleic Acids Res. 2021, doi: 10.1093/nar/gkab944 | Contact: Lukasz P. Kozlowski |
