Halopelagius longus
Taxonomy: cellular organisms; Archaea; Euryarchaeota; Stenosarchaea group; Halobacteria; Haloferacales; Haloferacaceae; Halopelagius
Average proteome isoelectric point is 4.96
Get precalculated fractions of proteins

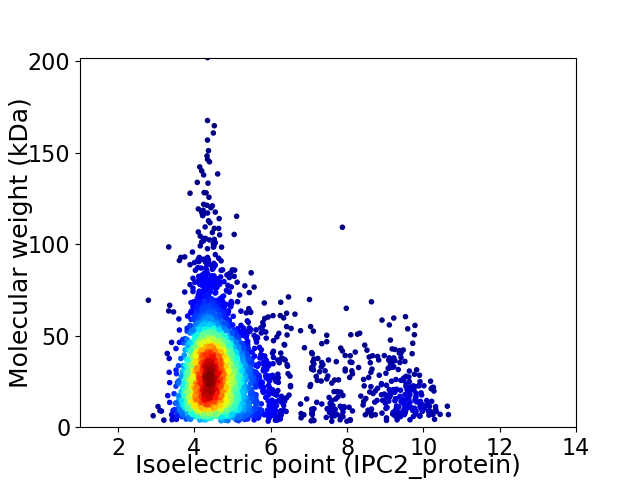
Virtual 2D-PAGE plot for 3802 proteins (isoelectric point calculated using IPC2_protein)
Get csv file with sequences according to given criteria:
* You can choose from 21 different methods for calculating isoelectric point
Summary statistics related to proteome-wise predictions


Protein with the lowest isoelectric point:
>tr|A0A1H1BB56|A0A1H1BB56_9EURY Sugar or nucleoside kinase ribokinase family OS=Halopelagius longus OX=1236180 GN=DWB78_02675 PE=4 SV=1
MM1 pKa = 7.35SIVVGGAAFGIFYY14 pKa = 8.23GTVVSSSRR22 pKa = 11.84RR23 pKa = 11.84LMTMEE28 pKa = 4.33LTWHH32 pKa = 6.17GHH34 pKa = 4.56STWHH38 pKa = 6.21VDD40 pKa = 3.02VDD42 pKa = 3.79GTTFLIDD49 pKa = 3.54PFFDD53 pKa = 3.79NPHH56 pKa = 6.37TDD58 pKa = 4.01LEE60 pKa = 4.64PEE62 pKa = 4.13DD63 pKa = 5.25VEE65 pKa = 4.58TPDD68 pKa = 4.52YY69 pKa = 11.42LLLTHH74 pKa = 6.38GHH76 pKa = 7.17ADD78 pKa = 3.89HH79 pKa = 6.89IADD82 pKa = 3.26VDD84 pKa = 3.9AFTDD88 pKa = 3.51ATLVAVPEE96 pKa = 4.35MTAFMQDD103 pKa = 2.64EE104 pKa = 4.82HH105 pKa = 8.35GFEE108 pKa = 4.69DD109 pKa = 5.39AIGMNLGGTTEE120 pKa = 4.48CGDD123 pKa = 3.89AFVTMHH129 pKa = 7.22RR130 pKa = 11.84ADD132 pKa = 3.55HH133 pKa = 6.09TNGLNTSYY141 pKa = 10.48EE142 pKa = 4.05NEE144 pKa = 3.99IGVPAGFVISDD155 pKa = 3.54EE156 pKa = 4.62RR157 pKa = 11.84PSQDD161 pKa = 3.39EE162 pKa = 4.38DD163 pKa = 3.89DD164 pKa = 4.48GATAFYY170 pKa = 10.37HH171 pKa = 6.94AGDD174 pKa = 3.8TALMSDD180 pKa = 4.88MIDD183 pKa = 3.48VIAPFLQPDD192 pKa = 3.96AAALPCGDD200 pKa = 4.89HH201 pKa = 5.97FTMGPWQAAVAADD214 pKa = 3.92WLGVDD219 pKa = 4.28HH220 pKa = 6.79VFPMHH225 pKa = 6.99YY226 pKa = 8.89DD227 pKa = 3.72TFPPIEE233 pKa = 5.09IDD235 pKa = 3.47VQDD238 pKa = 4.28FVDD241 pKa = 4.18EE242 pKa = 4.34VEE244 pKa = 4.4KK245 pKa = 10.45TGTDD249 pKa = 3.23ADD251 pKa = 3.99VHH253 pKa = 7.07VLDD256 pKa = 4.99GDD258 pKa = 3.57EE259 pKa = 5.0SYY261 pKa = 10.49TLEE264 pKa = 4.06
MM1 pKa = 7.35SIVVGGAAFGIFYY14 pKa = 8.23GTVVSSSRR22 pKa = 11.84RR23 pKa = 11.84LMTMEE28 pKa = 4.33LTWHH32 pKa = 6.17GHH34 pKa = 4.56STWHH38 pKa = 6.21VDD40 pKa = 3.02VDD42 pKa = 3.79GTTFLIDD49 pKa = 3.54PFFDD53 pKa = 3.79NPHH56 pKa = 6.37TDD58 pKa = 4.01LEE60 pKa = 4.64PEE62 pKa = 4.13DD63 pKa = 5.25VEE65 pKa = 4.58TPDD68 pKa = 4.52YY69 pKa = 11.42LLLTHH74 pKa = 6.38GHH76 pKa = 7.17ADD78 pKa = 3.89HH79 pKa = 6.89IADD82 pKa = 3.26VDD84 pKa = 3.9AFTDD88 pKa = 3.51ATLVAVPEE96 pKa = 4.35MTAFMQDD103 pKa = 2.64EE104 pKa = 4.82HH105 pKa = 8.35GFEE108 pKa = 4.69DD109 pKa = 5.39AIGMNLGGTTEE120 pKa = 4.48CGDD123 pKa = 3.89AFVTMHH129 pKa = 7.22RR130 pKa = 11.84ADD132 pKa = 3.55HH133 pKa = 6.09TNGLNTSYY141 pKa = 10.48EE142 pKa = 4.05NEE144 pKa = 3.99IGVPAGFVISDD155 pKa = 3.54EE156 pKa = 4.62RR157 pKa = 11.84PSQDD161 pKa = 3.39EE162 pKa = 4.38DD163 pKa = 3.89DD164 pKa = 4.48GATAFYY170 pKa = 10.37HH171 pKa = 6.94AGDD174 pKa = 3.8TALMSDD180 pKa = 4.88MIDD183 pKa = 3.48VIAPFLQPDD192 pKa = 3.96AAALPCGDD200 pKa = 4.89HH201 pKa = 5.97FTMGPWQAAVAADD214 pKa = 3.92WLGVDD219 pKa = 4.28HH220 pKa = 6.79VFPMHH225 pKa = 6.99YY226 pKa = 8.89DD227 pKa = 3.72TFPPIEE233 pKa = 5.09IDD235 pKa = 3.47VQDD238 pKa = 4.28FVDD241 pKa = 4.18EE242 pKa = 4.34VEE244 pKa = 4.4KK245 pKa = 10.45TGTDD249 pKa = 3.23ADD251 pKa = 3.99VHH253 pKa = 7.07VLDD256 pKa = 4.99GDD258 pKa = 3.57EE259 pKa = 5.0SYY261 pKa = 10.49TLEE264 pKa = 4.06
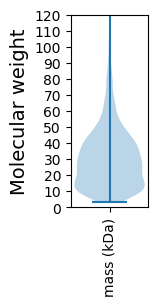
Molecular weight: 28.8 kDa
Isoelectric point according different methods:
Protein with the highest isoelectric point:
>tr|A0A1H1AFW9|A0A1H1AFW9_9EURY Winged helix-turn-helix DNA-binding OS=Halopelagius longus OX=1236180 GN=DWB78_00745 PE=4 SV=1
MM1 pKa = 7.22NVLFAFQIKK10 pKa = 10.49LMFPLFLRR18 pKa = 11.84LLLVNKK24 pKa = 9.99SDD26 pKa = 3.8SLPWSLFLLIILLVRR41 pKa = 11.84PCTFRR46 pKa = 11.84LKK48 pKa = 10.56FIQVSILQSSLLHH61 pKa = 6.11GGVVQGTVRR70 pKa = 11.84SLTALLPGINVRR82 pKa = 11.84VLPVYY87 pKa = 10.4IVDD90 pKa = 3.7DD91 pKa = 4.08HH92 pKa = 6.75LL93 pKa = 6.35
MM1 pKa = 7.22NVLFAFQIKK10 pKa = 10.49LMFPLFLRR18 pKa = 11.84LLLVNKK24 pKa = 9.99SDD26 pKa = 3.8SLPWSLFLLIILLVRR41 pKa = 11.84PCTFRR46 pKa = 11.84LKK48 pKa = 10.56FIQVSILQSSLLHH61 pKa = 6.11GGVVQGTVRR70 pKa = 11.84SLTALLPGINVRR82 pKa = 11.84VLPVYY87 pKa = 10.4IVDD90 pKa = 3.7DD91 pKa = 4.08HH92 pKa = 6.75LL93 pKa = 6.35
Molecular weight: 10.54 kDa
Isoelectric point according different methods:
Peptides (in silico digests for buttom-up proteomics)
Below you can find in silico digests of the whole proteome with Trypsin, Chymotrypsin, Trypsin+LysC, LysN, ArgC proteases suitable for different mass spec machines.| Try ESI |
 |
|---|
| ChTry ESI |
 |
|---|
| ArgC ESI |
 |
|---|
| LysN ESI |
 |
|---|
| TryLysC ESI |
 |
|---|
| Try MALDI |
 |
|---|
| ChTry MALDI |
 |
|---|
| ArgC MALDI |
 |
|---|
| LysN MALDI |
 |
|---|
| TryLysC MALDI |
 |
|---|
| Try LTQ |
 |
|---|
| ChTry LTQ |
 |
|---|
| ArgC LTQ |
 |
|---|
| LysN LTQ |
 |
|---|
| TryLysC LTQ |
 |
|---|
| Try MSlow |
 |
|---|
| ChTry MSlow |
 |
|---|
| ArgC MSlow |
 |
|---|
| LysN MSlow |
 |
|---|
| TryLysC MSlow |
 |
|---|
| Try MShigh |
 |
|---|
| ChTry MShigh |
 |
|---|
| ArgC MShigh |
 |
|---|
| LysN MShigh |
 |
|---|
| TryLysC MShigh |
 |
|---|
General Statistics
Number of major isoforms |
Number of additional isoforms |
Number of all proteins |
Number of amino acids |
Min. Seq. Length |
Max. Seq. Length |
Avg. Seq. Length |
Avg. Mol. Weight |
|---|---|---|---|---|---|---|---|
0 |
1114234 |
29 |
1805 |
293.1 |
31.87 |
Amino acid frequency
Ala |
Cys |
Asp |
Glu |
Phe |
Gly |
His |
Ile |
Lys |
Leu |
|---|---|---|---|---|---|---|---|---|---|
10.865 ± 0.058 | 0.669 ± 0.013 |
7.997 ± 0.049 | 8.998 ± 0.065 |
3.468 ± 0.024 | 8.645 ± 0.036 |
1.854 ± 0.02 | 3.539 ± 0.032 |
1.966 ± 0.027 | 8.702 ± 0.055 |
Met |
Asn |
Gln |
Pro |
Arg |
Ser |
Thr |
Val |
Trp |
Tyr |
|---|---|---|---|---|---|---|---|---|---|
1.775 ± 0.018 | 2.442 ± 0.025 |
4.642 ± 0.023 | 2.194 ± 0.024 |
6.913 ± 0.048 | 5.814 ± 0.033 |
6.168 ± 0.035 | 9.462 ± 0.048 |
1.149 ± 0.015 | 2.738 ± 0.018 |
Most of the basic statistics you can see at this page can be downloaded from this CSV file
Proteome-pI is available under Creative Commons Attribution-NoDerivs license, for more details see here
| Reference: Kozlowski LP. Proteome-pI 2.0: Proteome Isoelectric Point Database Update. Nucleic Acids Res. 2021, doi: 10.1093/nar/gkab944 | Contact: Lukasz P. Kozlowski |
