Dokdonia sp. (strain 4H-3-7-5) (Krokinobacter sp. (strain 4H-3-7-5))
Taxonomy: cellular organisms; Bacteria; FCB group; Bacteroidetes/Chlorobi group; Bacteroidetes; Flavobacteriia; Flavobacteriales; Flavobacteriaceae; Dokdonia; unclassified Dokdonia
Average proteome isoelectric point is 6.21
Get precalculated fractions of proteins

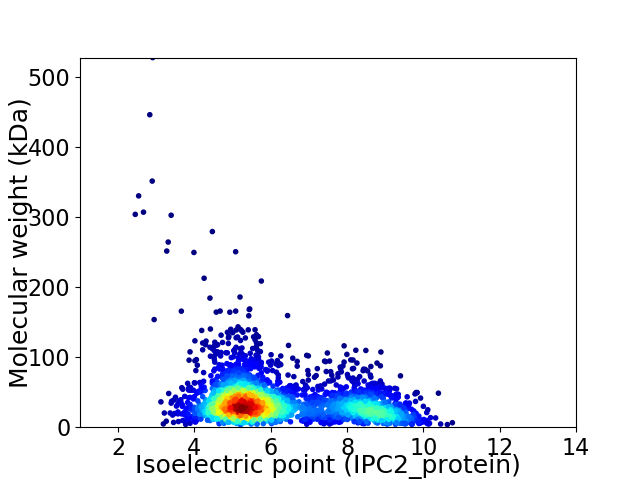
Virtual 2D-PAGE plot for 2978 proteins (isoelectric point calculated using IPC2_protein)
Get csv file with sequences according to given criteria:
* You can choose from 21 different methods for calculating isoelectric point
Summary statistics related to proteome-wise predictions


Protein with the lowest isoelectric point:
>tr|F4B1M5|F4B1M5_DOKS4 Uncharacterized protein OS=Dokdonia sp. (strain 4H-3-7-5) OX=983548 GN=Krodi_0556 PE=4 SV=1
MM1 pKa = 7.6KK2 pKa = 10.35KK3 pKa = 10.14FLFIILLCSYY13 pKa = 10.88AFAKK17 pKa = 10.58AQTTDD22 pKa = 3.1PALLVNIQKK31 pKa = 10.65ASQAEE36 pKa = 3.52IDD38 pKa = 4.0AFNIANLEE46 pKa = 3.77IGMLVYY52 pKa = 9.97NTDD55 pKa = 2.79VNRR58 pKa = 11.84IFEE61 pKa = 4.4YY62 pKa = 7.66TTSGFLVILTDD73 pKa = 3.59ADD75 pKa = 3.5VSEE78 pKa = 4.58TVTTFVDD85 pKa = 3.54NGNGTATYY93 pKa = 10.05TNEE96 pKa = 3.59NNTAVTVGIVGPQGPAGADD115 pKa = 3.3GATGATGPQGPAGADD130 pKa = 3.3GATGATGPQGPAGADD145 pKa = 3.3GATGATGPQGPAGADD160 pKa = 3.3GATGATGPQGPAGADD175 pKa = 3.3GATGATGAIGPQGPAGADD193 pKa = 3.3GATGATGPQGPIGPKK208 pKa = 9.26GTDD211 pKa = 3.19GATGATGPQGPAGADD226 pKa = 3.3GATGATGPQGDD237 pKa = 4.63TGPQGPTGATGADD250 pKa = 4.21GATGPAGPTGAQGPVGPQGPAGPTGAQGVEE280 pKa = 4.89GPQGPVGPSGTYY292 pKa = 9.04TGFFIIDD299 pKa = 3.52NSTLNTTGTYY309 pKa = 9.13SQSISGIPFEE319 pKa = 4.49PSQVTFKK326 pKa = 10.71AHH328 pKa = 6.21PNIGSFNINDD338 pKa = 3.92DD339 pKa = 3.88NALGANNTGLLEE351 pKa = 4.17NTFGAMNGFARR362 pKa = 11.84AGSPIAQAVIFSGGSGSSINNISRR386 pKa = 11.84YY387 pKa = 10.31ANNTQCIGLRR397 pKa = 11.84YY398 pKa = 8.09TNNNGSNLGVISASLASFTATGFNLNVTYY427 pKa = 10.21TLGTTGSAEE436 pKa = 4.14VQNDD440 pKa = 3.21ILDD443 pKa = 3.66EE444 pKa = 4.23SVIVLFTAYY453 pKa = 9.47EE454 pKa = 3.89
MM1 pKa = 7.6KK2 pKa = 10.35KK3 pKa = 10.14FLFIILLCSYY13 pKa = 10.88AFAKK17 pKa = 10.58AQTTDD22 pKa = 3.1PALLVNIQKK31 pKa = 10.65ASQAEE36 pKa = 3.52IDD38 pKa = 4.0AFNIANLEE46 pKa = 3.77IGMLVYY52 pKa = 9.97NTDD55 pKa = 2.79VNRR58 pKa = 11.84IFEE61 pKa = 4.4YY62 pKa = 7.66TTSGFLVILTDD73 pKa = 3.59ADD75 pKa = 3.5VSEE78 pKa = 4.58TVTTFVDD85 pKa = 3.54NGNGTATYY93 pKa = 10.05TNEE96 pKa = 3.59NNTAVTVGIVGPQGPAGADD115 pKa = 3.3GATGATGPQGPAGADD130 pKa = 3.3GATGATGPQGPAGADD145 pKa = 3.3GATGATGPQGPAGADD160 pKa = 3.3GATGATGPQGPAGADD175 pKa = 3.3GATGATGAIGPQGPAGADD193 pKa = 3.3GATGATGPQGPIGPKK208 pKa = 9.26GTDD211 pKa = 3.19GATGATGPQGPAGADD226 pKa = 3.3GATGATGPQGDD237 pKa = 4.63TGPQGPTGATGADD250 pKa = 4.21GATGPAGPTGAQGPVGPQGPAGPTGAQGVEE280 pKa = 4.89GPQGPVGPSGTYY292 pKa = 9.04TGFFIIDD299 pKa = 3.52NSTLNTTGTYY309 pKa = 9.13SQSISGIPFEE319 pKa = 4.49PSQVTFKK326 pKa = 10.71AHH328 pKa = 6.21PNIGSFNINDD338 pKa = 3.92DD339 pKa = 3.88NALGANNTGLLEE351 pKa = 4.17NTFGAMNGFARR362 pKa = 11.84AGSPIAQAVIFSGGSGSSINNISRR386 pKa = 11.84YY387 pKa = 10.31ANNTQCIGLRR397 pKa = 11.84YY398 pKa = 8.09TNNNGSNLGVISASLASFTATGFNLNVTYY427 pKa = 10.21TLGTTGSAEE436 pKa = 4.14VQNDD440 pKa = 3.21ILDD443 pKa = 3.66EE444 pKa = 4.23SVIVLFTAYY453 pKa = 9.47EE454 pKa = 3.89
Molecular weight: 43.89 kDa
Isoelectric point according different methods:
Protein with the highest isoelectric point:
>tr|F4AZV2|F4AZV2_DOKS4 Transcription termination factor Rho OS=Dokdonia sp. (strain 4H-3-7-5) OX=983548 GN=rho PE=3 SV=1
MM1 pKa = 7.69SKK3 pKa = 9.01RR4 pKa = 11.84TFQPSKK10 pKa = 9.13RR11 pKa = 11.84KK12 pKa = 9.48RR13 pKa = 11.84RR14 pKa = 11.84NKK16 pKa = 9.49HH17 pKa = 3.94GFRR20 pKa = 11.84EE21 pKa = 4.18RR22 pKa = 11.84MASVNGRR29 pKa = 11.84KK30 pKa = 9.21VLARR34 pKa = 11.84RR35 pKa = 11.84RR36 pKa = 11.84AKK38 pKa = 9.92GRR40 pKa = 11.84KK41 pKa = 8.34KK42 pKa = 10.21ISVSSEE48 pKa = 3.74TRR50 pKa = 11.84HH51 pKa = 5.96KK52 pKa = 10.68KK53 pKa = 9.8
MM1 pKa = 7.69SKK3 pKa = 9.01RR4 pKa = 11.84TFQPSKK10 pKa = 9.13RR11 pKa = 11.84KK12 pKa = 9.48RR13 pKa = 11.84RR14 pKa = 11.84NKK16 pKa = 9.49HH17 pKa = 3.94GFRR20 pKa = 11.84EE21 pKa = 4.18RR22 pKa = 11.84MASVNGRR29 pKa = 11.84KK30 pKa = 9.21VLARR34 pKa = 11.84RR35 pKa = 11.84RR36 pKa = 11.84AKK38 pKa = 9.92GRR40 pKa = 11.84KK41 pKa = 8.34KK42 pKa = 10.21ISVSSEE48 pKa = 3.74TRR50 pKa = 11.84HH51 pKa = 5.96KK52 pKa = 10.68KK53 pKa = 9.8
Molecular weight: 6.35 kDa
Isoelectric point according different methods:
Peptides (in silico digests for buttom-up proteomics)
Below you can find in silico digests of the whole proteome with Trypsin, Chymotrypsin, Trypsin+LysC, LysN, ArgC proteases suitable for different mass spec machines.| Try ESI |
 |
|---|
| ChTry ESI |
 |
|---|
| ArgC ESI |
 |
|---|
| LysN ESI |
 |
|---|
| TryLysC ESI |
 |
|---|
| Try MALDI |
 |
|---|
| ChTry MALDI |
 |
|---|
| ArgC MALDI |
 |
|---|
| LysN MALDI |
 |
|---|
| TryLysC MALDI |
 |
|---|
| Try LTQ |
 |
|---|
| ChTry LTQ |
 |
|---|
| ArgC LTQ |
 |
|---|
| LysN LTQ |
 |
|---|
| TryLysC LTQ |
 |
|---|
| Try MSlow |
 |
|---|
| ChTry MSlow |
 |
|---|
| ArgC MSlow |
 |
|---|
| LysN MSlow |
 |
|---|
| TryLysC MSlow |
 |
|---|
| Try MShigh |
 |
|---|
| ChTry MShigh |
 |
|---|
| ArgC MShigh |
 |
|---|
| LysN MShigh |
 |
|---|
| TryLysC MShigh |
 |
|---|
General Statistics
Number of major isoforms |
Number of additional isoforms |
Number of all proteins |
Number of amino acids |
Min. Seq. Length |
Max. Seq. Length |
Avg. Seq. Length |
Avg. Mol. Weight |
|---|---|---|---|---|---|---|---|
0 |
1016983 |
31 |
5218 |
341.5 |
38.25 |
Amino acid frequency
Ala |
Cys |
Asp |
Glu |
Phe |
Gly |
His |
Ile |
Lys |
Leu |
|---|---|---|---|---|---|---|---|---|---|
7.23 ± 0.048 | 0.698 ± 0.013 |
6.061 ± 0.067 | 6.577 ± 0.038 |
4.93 ± 0.044 | 6.682 ± 0.044 |
1.75 ± 0.03 | 7.573 ± 0.042 |
6.802 ± 0.077 | 9.126 ± 0.062 |
Met |
Asn |
Gln |
Pro |
Arg |
Ser |
Thr |
Val |
Trp |
Tyr |
|---|---|---|---|---|---|---|---|---|---|
2.248 ± 0.026 | 5.524 ± 0.062 |
3.453 ± 0.029 | 3.452 ± 0.028 |
3.731 ± 0.041 | 6.352 ± 0.038 |
6.346 ± 0.096 | 6.566 ± 0.047 |
0.989 ± 0.02 | 3.907 ± 0.03 |
Most of the basic statistics you can see at this page can be downloaded from this CSV file
Proteome-pI is available under Creative Commons Attribution-NoDerivs license, for more details see here
| Reference: Kozlowski LP. Proteome-pI 2.0: Proteome Isoelectric Point Database Update. Nucleic Acids Res. 2021, doi: 10.1093/nar/gkab944 | Contact: Lukasz P. Kozlowski |
