methanogenic archaeon ISO4-H5
Taxonomy: cellular organisms; Archaea; Candidatus Thermoplasmatota; Thermoplasmata; unclassified Thermoplasmata
Average proteome isoelectric point is 5.76
Get precalculated fractions of proteins

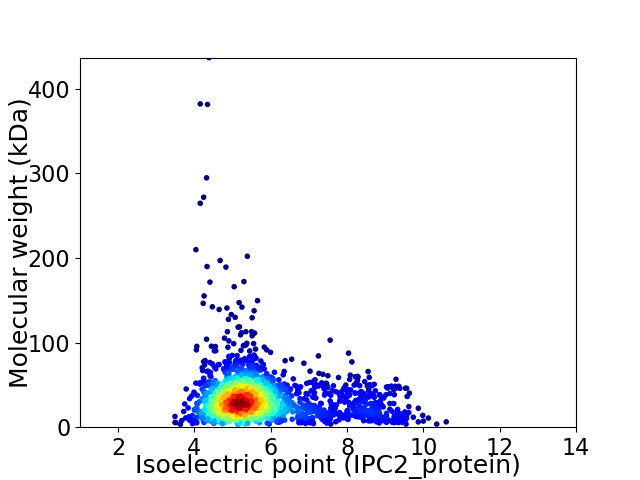
Virtual 2D-PAGE plot for 1805 proteins (isoelectric point calculated using IPC2_protein)
Get csv file with sequences according to given criteria:
* You can choose from 21 different methods for calculating isoelectric point
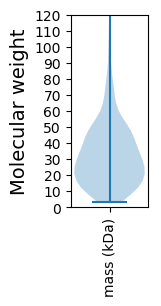
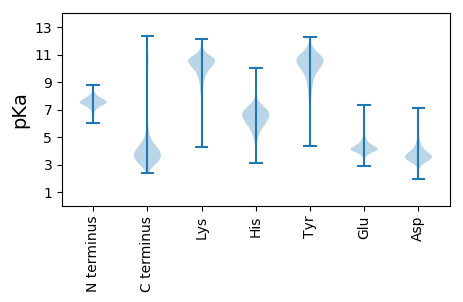
Summary statistics related to proteome-wise predictions


Protein with the lowest isoelectric point:
>tr|A0A0X8UZ55|A0A0X8UZ55_9ARCH Uncharacterized protein OS=methanogenic archaeon ISO4-H5 OX=1495144 GN=AR505_1103 PE=4 SV=1
MM1 pKa = 7.3MGFTLSRR8 pKa = 11.84IALFACGAILMAAVAVPISEE28 pKa = 4.47MYY30 pKa = 9.85QDD32 pKa = 4.35RR33 pKa = 11.84GNDD36 pKa = 3.67SIEE39 pKa = 4.13KK40 pKa = 9.76VAEE43 pKa = 4.02ADD45 pKa = 3.68AMFVDD50 pKa = 4.69ALWDD54 pKa = 3.17IDD56 pKa = 3.65MDD58 pKa = 3.97EE59 pKa = 4.1TALRR63 pKa = 11.84GDD65 pKa = 3.68ILLPSPAYY73 pKa = 10.27GLIIDD78 pKa = 5.4GYY80 pKa = 10.34FLTISDD86 pKa = 4.94DD87 pKa = 4.01DD88 pKa = 4.56GNSYY92 pKa = 10.75VSSLKK97 pKa = 10.48HH98 pKa = 4.53RR99 pKa = 11.84TDD101 pKa = 4.25RR102 pKa = 11.84IEE104 pKa = 4.36LGYY107 pKa = 10.54GDD109 pKa = 4.16SVNVCRR115 pKa = 11.84YY116 pKa = 9.31GDD118 pKa = 3.66KK119 pKa = 11.23LMLCSNVPDD128 pKa = 4.72DD129 pKa = 4.57EE130 pKa = 4.92PVTEE134 pKa = 4.35TDD136 pKa = 4.8PLEE139 pKa = 4.79DD140 pKa = 3.66WDD142 pKa = 4.18TAPPEE147 pKa = 4.22EE148 pKa = 4.51PSAGNSYY155 pKa = 8.55TVTNEE160 pKa = 3.69SGNSITISCGPAA172 pKa = 2.78
MM1 pKa = 7.3MGFTLSRR8 pKa = 11.84IALFACGAILMAAVAVPISEE28 pKa = 4.47MYY30 pKa = 9.85QDD32 pKa = 4.35RR33 pKa = 11.84GNDD36 pKa = 3.67SIEE39 pKa = 4.13KK40 pKa = 9.76VAEE43 pKa = 4.02ADD45 pKa = 3.68AMFVDD50 pKa = 4.69ALWDD54 pKa = 3.17IDD56 pKa = 3.65MDD58 pKa = 3.97EE59 pKa = 4.1TALRR63 pKa = 11.84GDD65 pKa = 3.68ILLPSPAYY73 pKa = 10.27GLIIDD78 pKa = 5.4GYY80 pKa = 10.34FLTISDD86 pKa = 4.94DD87 pKa = 4.01DD88 pKa = 4.56GNSYY92 pKa = 10.75VSSLKK97 pKa = 10.48HH98 pKa = 4.53RR99 pKa = 11.84TDD101 pKa = 4.25RR102 pKa = 11.84IEE104 pKa = 4.36LGYY107 pKa = 10.54GDD109 pKa = 4.16SVNVCRR115 pKa = 11.84YY116 pKa = 9.31GDD118 pKa = 3.66KK119 pKa = 11.23LMLCSNVPDD128 pKa = 4.72DD129 pKa = 4.57EE130 pKa = 4.92PVTEE134 pKa = 4.35TDD136 pKa = 4.8PLEE139 pKa = 4.79DD140 pKa = 3.66WDD142 pKa = 4.18TAPPEE147 pKa = 4.22EE148 pKa = 4.51PSAGNSYY155 pKa = 8.55TVTNEE160 pKa = 3.69SGNSITISCGPAA172 pKa = 2.78
Molecular weight: 18.59 kDa
Isoelectric point according different methods:
Protein with the highest isoelectric point:
>tr|A0A110A296|A0A110A296_9ARCH Thiazole synthase OS=methanogenic archaeon ISO4-H5 OX=1495144 GN=AR505_0102 PE=4 SV=1
MM1 pKa = 7.44GAGTAAQGRR10 pKa = 11.84HH11 pKa = 5.4NKK13 pKa = 9.66HH14 pKa = 5.67KK15 pKa = 9.2THH17 pKa = 6.56IPCRR21 pKa = 11.84RR22 pKa = 11.84CGKK25 pKa = 9.77RR26 pKa = 11.84SYY28 pKa = 10.65SVRR31 pKa = 11.84KK32 pKa = 9.32GICASCGYY40 pKa = 10.42GKK42 pKa = 7.63TARR45 pKa = 11.84IRR47 pKa = 11.84TYY49 pKa = 8.52TWAKK53 pKa = 8.49VHH55 pKa = 5.91EE56 pKa = 4.42
MM1 pKa = 7.44GAGTAAQGRR10 pKa = 11.84HH11 pKa = 5.4NKK13 pKa = 9.66HH14 pKa = 5.67KK15 pKa = 9.2THH17 pKa = 6.56IPCRR21 pKa = 11.84RR22 pKa = 11.84CGKK25 pKa = 9.77RR26 pKa = 11.84SYY28 pKa = 10.65SVRR31 pKa = 11.84KK32 pKa = 9.32GICASCGYY40 pKa = 10.42GKK42 pKa = 7.63TARR45 pKa = 11.84IRR47 pKa = 11.84TYY49 pKa = 8.52TWAKK53 pKa = 8.49VHH55 pKa = 5.91EE56 pKa = 4.42
Molecular weight: 6.25 kDa
Isoelectric point according different methods:
Peptides (in silico digests for buttom-up proteomics)
Below you can find in silico digests of the whole proteome with Trypsin, Chymotrypsin, Trypsin+LysC, LysN, ArgC proteases suitable for different mass spec machines.| Try ESI |
 |
|---|
| ChTry ESI |
 |
|---|
| ArgC ESI |
 |
|---|
| LysN ESI |
 |
|---|
| TryLysC ESI |
 |
|---|
| Try MALDI |
 |
|---|
| ChTry MALDI |
 |
|---|
| ArgC MALDI |
 |
|---|
| LysN MALDI |
 |
|---|
| TryLysC MALDI |
 |
|---|
| Try LTQ |
 |
|---|
| ChTry LTQ |
 |
|---|
| ArgC LTQ |
 |
|---|
| LysN LTQ |
 |
|---|
| TryLysC LTQ |
 |
|---|
| Try MSlow |
 |
|---|
| ChTry MSlow |
 |
|---|
| ArgC MSlow |
 |
|---|
| LysN MSlow |
 |
|---|
| TryLysC MSlow |
 |
|---|
| Try MShigh |
 |
|---|
| ChTry MShigh |
 |
|---|
| ArgC MShigh |
 |
|---|
| LysN MShigh |
 |
|---|
| TryLysC MShigh |
 |
|---|
General Statistics
Number of major isoforms |
Number of additional isoforms |
Number of all proteins |
Number of amino acids |
Min. Seq. Length |
Max. Seq. Length |
Avg. Seq. Length |
Avg. Mol. Weight |
|---|---|---|---|---|---|---|---|
0 |
574731 |
29 |
3978 |
318.4 |
35.27 |
Amino acid frequency
Ala |
Cys |
Asp |
Glu |
Phe |
Gly |
His |
Ile |
Lys |
Leu |
|---|---|---|---|---|---|---|---|---|---|
8.001 ± 0.075 | 1.667 ± 0.027 |
6.509 ± 0.042 | 6.697 ± 0.063 |
3.89 ± 0.036 | 7.724 ± 0.054 |
1.689 ± 0.022 | 6.896 ± 0.055 |
5.948 ± 0.059 | 8.265 ± 0.058 |
Met |
Asn |
Gln |
Pro |
Arg |
Ser |
Thr |
Val |
Trp |
Tyr |
|---|---|---|---|---|---|---|---|---|---|
3.201 ± 0.035 | 3.861 ± 0.042 |
3.891 ± 0.038 | 2.346 ± 0.024 |
4.946 ± 0.061 | 6.472 ± 0.074 |
5.811 ± 0.086 | 7.479 ± 0.051 |
0.952 ± 0.02 | 3.751 ± 0.047 |
Most of the basic statistics you can see at this page can be downloaded from this CSV file
Proteome-pI is available under Creative Commons Attribution-NoDerivs license, for more details see here
| Reference: Kozlowski LP. Proteome-pI 2.0: Proteome Isoelectric Point Database Update. Nucleic Acids Res. 2021, doi: 10.1093/nar/gkab944 | Contact: Lukasz P. Kozlowski |
