Talaromyces marneffei (strain ATCC 18224 / CBS 334.59 / QM 7333) (Penicillium marneffei)
Taxonomy: cellular organisms; Eukaryota; Opisthokonta; Fungi; Dikarya; Ascomycota; saccharomyceta; Pezizomycotina; leotiomyceta; Eurotiomycetes; Eurotiomycetidae; Eurotiales; Trichocomaceae; Talaromyces; Talaromyces sect. Talaromyces; Talaromyces marneffei
Average proteome isoelectric point is 6.38
Get precalculated fractions of proteins
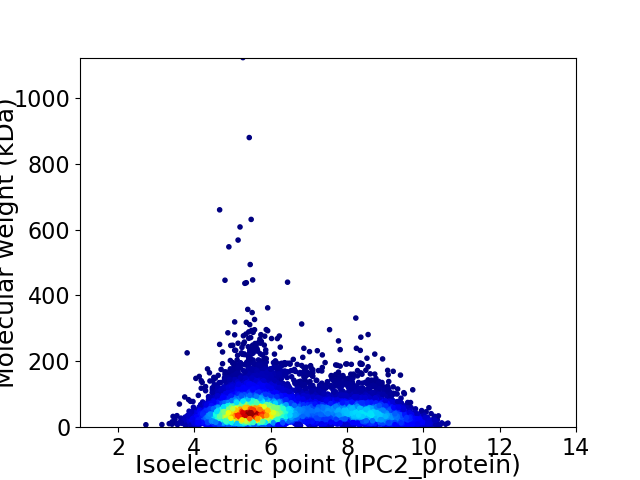
Virtual 2D-PAGE plot for 10448 proteins (isoelectric point calculated using IPC2_protein)
Get csv file with sequences according to given criteria:
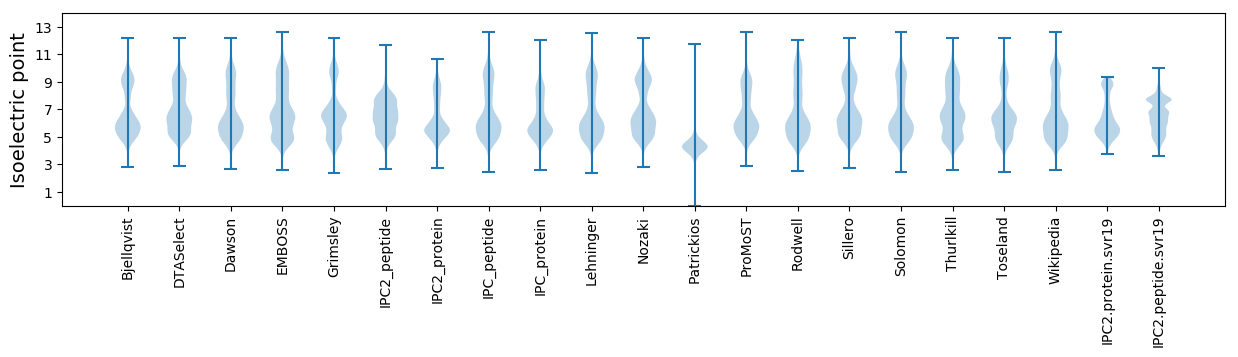
* You can choose from 21 different methods for calculating isoelectric point
Summary statistics related to proteome-wise predictions
Protein with the lowest isoelectric point:
>tr|B6QJD3|B6QJD3_TALMQ Uncharacterized protein OS=Talaromyces marneffei (strain ATCC 18224 / CBS 334.59 / QM 7333) OX=441960 GN=PMAA_090770 PE=4 SV=1
MM1 pKa = 7.68IGFLDD6 pKa = 3.91LPGEE10 pKa = 4.17IRR12 pKa = 11.84NLIYY16 pKa = 10.27DD17 pKa = 4.18HH18 pKa = 7.37PLMFQEE24 pKa = 5.78PIVPWAKK31 pKa = 10.09EE32 pKa = 3.52QALPISLFYY41 pKa = 10.28TNKK44 pKa = 8.32TIYY47 pKa = 10.43RR48 pKa = 11.84EE49 pKa = 4.17FCSLFYY55 pKa = 11.14SRR57 pKa = 11.84ITFNFTSHH65 pKa = 6.28EE66 pKa = 4.27LGHH69 pKa = 6.5EE70 pKa = 4.12EE71 pKa = 4.17HH72 pKa = 6.31QCPARR77 pKa = 11.84LTKK80 pKa = 10.37QVTSFLDD87 pKa = 3.74QIGQNAKK94 pKa = 9.87YY95 pKa = 9.9IEE97 pKa = 4.6SIKK100 pKa = 10.49PDD102 pKa = 4.1FPPQEE107 pKa = 3.88IRR109 pKa = 11.84DD110 pKa = 4.03LGWEE114 pKa = 4.15VEE116 pKa = 4.54LVDD119 pKa = 4.96PLDD122 pKa = 4.21SQWMIDD128 pKa = 4.73DD129 pKa = 5.4DD130 pKa = 4.07EE131 pKa = 7.13HH132 pKa = 9.17DD133 pKa = 5.53DD134 pKa = 4.97DD135 pKa = 7.28DD136 pKa = 6.11EE137 pKa = 6.33DD138 pKa = 5.17VDD140 pKa = 5.21DD141 pKa = 6.29AKK143 pKa = 11.38DD144 pKa = 3.6DD145 pKa = 3.72YY146 pKa = 11.48DD147 pKa = 4.25YY148 pKa = 11.86YY149 pKa = 11.18EE150 pKa = 4.76SYY152 pKa = 11.31EE153 pKa = 4.07DD154 pKa = 5.51DD155 pKa = 3.89EE156 pKa = 5.86YY157 pKa = 11.84GDD159 pKa = 3.63EE160 pKa = 4.55DD161 pKa = 5.03DD162 pKa = 4.65YY163 pKa = 11.99YY164 pKa = 11.22DD165 pKa = 4.12YY166 pKa = 11.18EE167 pKa = 4.32SHH169 pKa = 7.1EE170 pKa = 4.96DD171 pKa = 3.9EE172 pKa = 5.96DD173 pKa = 6.45DD174 pKa = 3.59EE175 pKa = 7.26DD176 pKa = 4.84EE177 pKa = 5.85DD178 pKa = 5.58DD179 pKa = 4.73GSGDD183 pKa = 3.52GSDD186 pKa = 4.06GEE188 pKa = 4.47EE189 pKa = 3.83
MM1 pKa = 7.68IGFLDD6 pKa = 3.91LPGEE10 pKa = 4.17IRR12 pKa = 11.84NLIYY16 pKa = 10.27DD17 pKa = 4.18HH18 pKa = 7.37PLMFQEE24 pKa = 5.78PIVPWAKK31 pKa = 10.09EE32 pKa = 3.52QALPISLFYY41 pKa = 10.28TNKK44 pKa = 8.32TIYY47 pKa = 10.43RR48 pKa = 11.84EE49 pKa = 4.17FCSLFYY55 pKa = 11.14SRR57 pKa = 11.84ITFNFTSHH65 pKa = 6.28EE66 pKa = 4.27LGHH69 pKa = 6.5EE70 pKa = 4.12EE71 pKa = 4.17HH72 pKa = 6.31QCPARR77 pKa = 11.84LTKK80 pKa = 10.37QVTSFLDD87 pKa = 3.74QIGQNAKK94 pKa = 9.87YY95 pKa = 9.9IEE97 pKa = 4.6SIKK100 pKa = 10.49PDD102 pKa = 4.1FPPQEE107 pKa = 3.88IRR109 pKa = 11.84DD110 pKa = 4.03LGWEE114 pKa = 4.15VEE116 pKa = 4.54LVDD119 pKa = 4.96PLDD122 pKa = 4.21SQWMIDD128 pKa = 4.73DD129 pKa = 5.4DD130 pKa = 4.07EE131 pKa = 7.13HH132 pKa = 9.17DD133 pKa = 5.53DD134 pKa = 4.97DD135 pKa = 7.28DD136 pKa = 6.11EE137 pKa = 6.33DD138 pKa = 5.17VDD140 pKa = 5.21DD141 pKa = 6.29AKK143 pKa = 11.38DD144 pKa = 3.6DD145 pKa = 3.72YY146 pKa = 11.48DD147 pKa = 4.25YY148 pKa = 11.86YY149 pKa = 11.18EE150 pKa = 4.76SYY152 pKa = 11.31EE153 pKa = 4.07DD154 pKa = 5.51DD155 pKa = 3.89EE156 pKa = 5.86YY157 pKa = 11.84GDD159 pKa = 3.63EE160 pKa = 4.55DD161 pKa = 5.03DD162 pKa = 4.65YY163 pKa = 11.99YY164 pKa = 11.22DD165 pKa = 4.12YY166 pKa = 11.18EE167 pKa = 4.32SHH169 pKa = 7.1EE170 pKa = 4.96DD171 pKa = 3.9EE172 pKa = 5.96DD173 pKa = 6.45DD174 pKa = 3.59EE175 pKa = 7.26DD176 pKa = 4.84EE177 pKa = 5.85DD178 pKa = 5.58DD179 pKa = 4.73GSGDD183 pKa = 3.52GSDD186 pKa = 4.06GEE188 pKa = 4.47EE189 pKa = 3.83
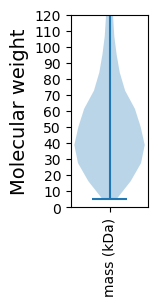
Molecular weight: 22.27 kDa
Isoelectric point according different methods:
Protein with the highest isoelectric point:
>tr|B6QKP2|B6QKP2_TALMQ Endo-1 3(4)-beta-glucanase OS=Talaromyces marneffei (strain ATCC 18224 / CBS 334.59 / QM 7333) OX=441960 GN=PMAA_054650 PE=3 SV=1
MM1 pKa = 7.17PAKK4 pKa = 10.23GASTRR9 pKa = 11.84LNPVRR14 pKa = 11.84LQTIQHH20 pKa = 5.6LRR22 pKa = 11.84VRR24 pKa = 11.84RR25 pKa = 11.84PNQQQQNSCATIMSSMLNCWASAGQGNEE53 pKa = 3.91GCSGLEE59 pKa = 3.96EE60 pKa = 4.16SLKK63 pKa = 10.96ACMDD67 pKa = 3.31GRR69 pKa = 11.84RR70 pKa = 11.84DD71 pKa = 3.41TTSANNAVNYY81 pKa = 10.05HH82 pKa = 5.96LMRR85 pKa = 11.84MFPKK89 pKa = 10.4VSGPRR94 pKa = 11.84KK95 pKa = 9.27RR96 pKa = 11.84EE97 pKa = 3.63GRR99 pKa = 11.84LGG101 pKa = 3.44
MM1 pKa = 7.17PAKK4 pKa = 10.23GASTRR9 pKa = 11.84LNPVRR14 pKa = 11.84LQTIQHH20 pKa = 5.6LRR22 pKa = 11.84VRR24 pKa = 11.84RR25 pKa = 11.84PNQQQQNSCATIMSSMLNCWASAGQGNEE53 pKa = 3.91GCSGLEE59 pKa = 3.96EE60 pKa = 4.16SLKK63 pKa = 10.96ACMDD67 pKa = 3.31GRR69 pKa = 11.84RR70 pKa = 11.84DD71 pKa = 3.41TTSANNAVNYY81 pKa = 10.05HH82 pKa = 5.96LMRR85 pKa = 11.84MFPKK89 pKa = 10.4VSGPRR94 pKa = 11.84KK95 pKa = 9.27RR96 pKa = 11.84EE97 pKa = 3.63GRR99 pKa = 11.84LGG101 pKa = 3.44
Molecular weight: 11.16 kDa
Isoelectric point according different methods:
Peptides (in silico digests for buttom-up proteomics)
Below you can find in silico digests of the whole proteome with Trypsin, Chymotrypsin, Trypsin+LysC, LysN, ArgC proteases suitable for different mass spec machines.| Try ESI |
 |
|---|
| ChTry ESI |
|
|---|
| ArgC ESI |
|
|---|
| LysN ESI |
|
|---|
| TryLysC ESI |
|
|---|
| Try MALDI |
|
|---|
| ChTry MALDI |
|
|---|
| ArgC MALDI |
|
|---|
| LysN MALDI |
|
|---|
| TryLysC MALDI |
|
|---|
| Try LTQ |
|
|---|
| ChTry LTQ |
|
|---|
| ArgC LTQ |
|
|---|
| LysN LTQ |
|
|---|
| TryLysC LTQ |
|
|---|
| Try MSlow |
|
|---|
| ChTry MSlow |
|
|---|
| ArgC MSlow |
|
|---|
| LysN MSlow |
|
|---|
| TryLysC MSlow |
|
|---|
| Try MShigh |
|
|---|
| ChTry MShigh |
|
|---|
| ArgC MShigh |
|
|---|
| LysN MShigh |
|
|---|
| TryLysC MShigh |
|
|---|
General Statistics
Number of major isoforms |
Number of additional isoforms |
Number of all proteins |
Number of amino acids |
Min. Seq. Length |
Max. Seq. Length |
Avg. Seq. Length |
Avg. Mol. Weight |
|---|---|---|---|---|---|---|---|
5285136 |
44 |
10022 |
505.9 |
56.21 |
Amino acid frequency
Ala |
Cys |
Asp |
Glu |
Phe |
Gly |
His |
Ile |
Lys |
Leu |
|---|---|---|---|---|---|---|---|---|---|
8.149 ± 0.022 | 1.161 ± 0.009 |
5.695 ± 0.02 | 6.228 ± 0.023 |
3.745 ± 0.013 | 6.499 ± 0.023 |
2.38 ± 0.01 | 5.438 ± 0.016 |
4.915 ± 0.022 | 8.947 ± 0.026 |
Met |
Asn |
Gln |
Pro |
Arg |
Ser |
Thr |
Val |
Trp |
Tyr |
|---|---|---|---|---|---|---|---|---|---|
2.14 ± 0.009 | 3.998 ± 0.011 |
5.69 ± 0.023 | 4.149 ± 0.017 |
5.951 ± 0.019 | 8.357 ± 0.027 |
6.151 ± 0.016 | 6.053 ± 0.016 |
1.425 ± 0.008 | 2.929 ± 0.013 |
Most of the basic statistics you can see at this page can be downloaded from this CSV file
See this proteome in:

Proteome-pI is available under Creative Commons Attribution-NoDerivs license, for more details see here
| Reference: Kozlowski LP. Proteome-pI 2.0: Proteome Isoelectric Point Database Update. Nucleic Acids Res. 2021, doi: 10.1093/nar/gkab944 | Contact: Lukasz P. Kozlowski |