Wuhan spider virus 6
Taxonomy: Viruses; Riboviria; unclassified Riboviria; unclassified RNA viruses ShiM-2016
Average proteome isoelectric point is 6.43
Get precalculated fractions of proteins

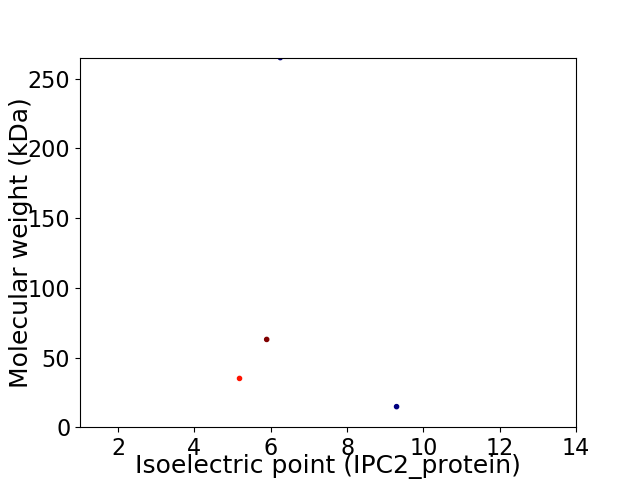
Virtual 2D-PAGE plot for 4 proteins (isoelectric point calculated using IPC2_protein)
Get csv file with sequences according to given criteria:
* You can choose from 21 different methods for calculating isoelectric point
Summary statistics related to proteome-wise predictions


Protein with the lowest isoelectric point:
>tr|A0A1L3KJB2|A0A1L3KJB2_9VIRU Calici_coat domain-containing protein OS=Wuhan spider virus 6 OX=1923755 PE=4 SV=1
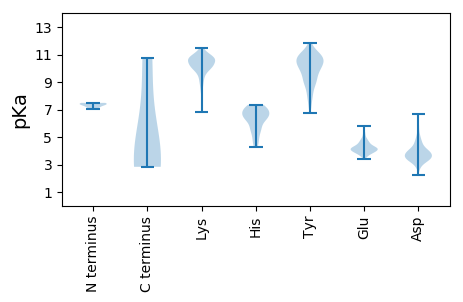
MM1 pKa = 7.36GFIMANISARR11 pKa = 11.84LFGDD15 pKa = 4.3EE16 pKa = 3.96IVEE19 pKa = 4.13MAEE22 pKa = 4.81RR23 pKa = 11.84RR24 pKa = 11.84AQEE27 pKa = 3.45NDD29 pKa = 2.74RR30 pKa = 11.84FGNQDD35 pKa = 3.49EE36 pKa = 4.71FPGYY40 pKa = 9.07QANNSDD46 pKa = 3.84PDD48 pKa = 3.84ALLEE52 pKa = 4.41AVDD55 pKa = 5.54FSPEE59 pKa = 4.3SITTNDD65 pKa = 3.1SLQPIVQKK73 pKa = 11.28LEE75 pKa = 3.93DD76 pKa = 3.79VQTAIKK82 pKa = 10.6DD83 pKa = 4.23LINSEE88 pKa = 4.23AVDD91 pKa = 3.59GRR93 pKa = 11.84MLEE96 pKa = 4.22DD97 pKa = 4.6LFTKK101 pKa = 10.22RR102 pKa = 11.84DD103 pKa = 3.59ALQGIMRR110 pKa = 11.84ASTFVRR116 pKa = 11.84MRR118 pKa = 11.84SAFPTMCAIGARR130 pKa = 11.84VSNDD134 pKa = 2.21ATTRR138 pKa = 11.84DD139 pKa = 3.74ACWALDD145 pKa = 3.32RR146 pKa = 11.84VLKK149 pKa = 10.96RR150 pKa = 11.84EE151 pKa = 3.77FTDD154 pKa = 4.02FFGSEE159 pKa = 4.26SNRR162 pKa = 11.84PYY164 pKa = 10.25PFPYY168 pKa = 10.04SRR170 pKa = 11.84FVDD173 pKa = 3.39IHH175 pKa = 6.01TLTLAKK181 pKa = 10.41ANNIFFQNHH190 pKa = 5.66PFAFGLKK197 pKa = 9.17YY198 pKa = 10.87YY199 pKa = 9.93QDD201 pKa = 3.74QIMAIARR208 pKa = 11.84NEE210 pKa = 3.76GNMRR214 pKa = 11.84KK215 pKa = 9.44RR216 pKa = 11.84KK217 pKa = 9.61HH218 pKa = 6.35KK219 pKa = 10.12ILNVLRR225 pKa = 11.84NCQSYY230 pKa = 9.82ISKK233 pKa = 10.82NYY235 pKa = 9.54FVYY238 pKa = 10.37KK239 pKa = 10.06GSPSIWYY246 pKa = 9.54DD247 pKa = 3.24DD248 pKa = 3.59GTEE251 pKa = 3.84VDD253 pKa = 5.93DD254 pKa = 5.76AIEE257 pKa = 3.86WLIDD261 pKa = 3.75FPEE264 pKa = 4.46VNSHH268 pKa = 5.53GFQMLATLPGGLNYY282 pKa = 10.53YY283 pKa = 7.99STYY286 pKa = 9.46WLSLRR291 pKa = 11.84AIALQNPVLRR301 pKa = 11.84ATIQPP306 pKa = 3.67
MM1 pKa = 7.36GFIMANISARR11 pKa = 11.84LFGDD15 pKa = 4.3EE16 pKa = 3.96IVEE19 pKa = 4.13MAEE22 pKa = 4.81RR23 pKa = 11.84RR24 pKa = 11.84AQEE27 pKa = 3.45NDD29 pKa = 2.74RR30 pKa = 11.84FGNQDD35 pKa = 3.49EE36 pKa = 4.71FPGYY40 pKa = 9.07QANNSDD46 pKa = 3.84PDD48 pKa = 3.84ALLEE52 pKa = 4.41AVDD55 pKa = 5.54FSPEE59 pKa = 4.3SITTNDD65 pKa = 3.1SLQPIVQKK73 pKa = 11.28LEE75 pKa = 3.93DD76 pKa = 3.79VQTAIKK82 pKa = 10.6DD83 pKa = 4.23LINSEE88 pKa = 4.23AVDD91 pKa = 3.59GRR93 pKa = 11.84MLEE96 pKa = 4.22DD97 pKa = 4.6LFTKK101 pKa = 10.22RR102 pKa = 11.84DD103 pKa = 3.59ALQGIMRR110 pKa = 11.84ASTFVRR116 pKa = 11.84MRR118 pKa = 11.84SAFPTMCAIGARR130 pKa = 11.84VSNDD134 pKa = 2.21ATTRR138 pKa = 11.84DD139 pKa = 3.74ACWALDD145 pKa = 3.32RR146 pKa = 11.84VLKK149 pKa = 10.96RR150 pKa = 11.84EE151 pKa = 3.77FTDD154 pKa = 4.02FFGSEE159 pKa = 4.26SNRR162 pKa = 11.84PYY164 pKa = 10.25PFPYY168 pKa = 10.04SRR170 pKa = 11.84FVDD173 pKa = 3.39IHH175 pKa = 6.01TLTLAKK181 pKa = 10.41ANNIFFQNHH190 pKa = 5.66PFAFGLKK197 pKa = 9.17YY198 pKa = 10.87YY199 pKa = 9.93QDD201 pKa = 3.74QIMAIARR208 pKa = 11.84NEE210 pKa = 3.76GNMRR214 pKa = 11.84KK215 pKa = 9.44RR216 pKa = 11.84KK217 pKa = 9.61HH218 pKa = 6.35KK219 pKa = 10.12ILNVLRR225 pKa = 11.84NCQSYY230 pKa = 9.82ISKK233 pKa = 10.82NYY235 pKa = 9.54FVYY238 pKa = 10.37KK239 pKa = 10.06GSPSIWYY246 pKa = 9.54DD247 pKa = 3.24DD248 pKa = 3.59GTEE251 pKa = 3.84VDD253 pKa = 5.93DD254 pKa = 5.76AIEE257 pKa = 3.86WLIDD261 pKa = 3.75FPEE264 pKa = 4.46VNSHH268 pKa = 5.53GFQMLATLPGGLNYY282 pKa = 10.53YY283 pKa = 7.99STYY286 pKa = 9.46WLSLRR291 pKa = 11.84AIALQNPVLRR301 pKa = 11.84ATIQPP306 pKa = 3.67
Molecular weight: 34.99 kDa
Isoelectric point according different methods:
Protein with the highest isoelectric point:
>tr|A0A1L3KJ37|A0A1L3KJ37_9VIRU Uncharacterized protein OS=Wuhan spider virus 6 OX=1923755 PE=4 SV=1
MM1 pKa = 7.4AQAQGLGLLINRR13 pKa = 11.84AADD16 pKa = 3.73YY17 pKa = 10.52QKK19 pKa = 11.11SAFDD23 pKa = 3.24TGLNYY28 pKa = 10.65LSNSALQNNFWNNKK42 pKa = 7.11QNYY45 pKa = 7.83QSNILNYY52 pKa = 10.72ANTLQRR58 pKa = 11.84SNFNYY63 pKa = 10.29LMDD66 pKa = 4.22MKK68 pKa = 10.7QDD70 pKa = 3.79SLQKK74 pKa = 10.67AGLPSYY80 pKa = 11.08LKK82 pKa = 10.69FSGNLPFGTPFSSQAMSGQNYY103 pKa = 10.06LNSTLPGNAARR114 pKa = 11.84APYY117 pKa = 9.82NAYY120 pKa = 8.71STQNLGWGQAPTYY133 pKa = 10.77
MM1 pKa = 7.4AQAQGLGLLINRR13 pKa = 11.84AADD16 pKa = 3.73YY17 pKa = 10.52QKK19 pKa = 11.11SAFDD23 pKa = 3.24TGLNYY28 pKa = 10.65LSNSALQNNFWNNKK42 pKa = 7.11QNYY45 pKa = 7.83QSNILNYY52 pKa = 10.72ANTLQRR58 pKa = 11.84SNFNYY63 pKa = 10.29LMDD66 pKa = 4.22MKK68 pKa = 10.7QDD70 pKa = 3.79SLQKK74 pKa = 10.67AGLPSYY80 pKa = 11.08LKK82 pKa = 10.69FSGNLPFGTPFSSQAMSGQNYY103 pKa = 10.06LNSTLPGNAARR114 pKa = 11.84APYY117 pKa = 9.82NAYY120 pKa = 8.71STQNLGWGQAPTYY133 pKa = 10.77
Molecular weight: 14.76 kDa
Isoelectric point according different methods:
Peptides (in silico digests for buttom-up proteomics)
Below you can find in silico digests of the whole proteome with Trypsin, Chymotrypsin, Trypsin+LysC, LysN, ArgC proteases suitable for different mass spec machines.| Try ESI |
 |
|---|
| ChTry ESI |
 |
|---|
| ArgC ESI |
 |
|---|
| LysN ESI |
 |
|---|
| TryLysC ESI |
 |
|---|
| Try MALDI |
 |
|---|
| ChTry MALDI |
 |
|---|
| ArgC MALDI |
 |
|---|
| LysN MALDI |
 |
|---|
| TryLysC MALDI |
 |
|---|
| Try LTQ |
 |
|---|
| ChTry LTQ |
 |
|---|
| ArgC LTQ |
 |
|---|
| LysN LTQ |
 |
|---|
| TryLysC LTQ |
 |
|---|
| Try MSlow |
 |
|---|
| ChTry MSlow |
 |
|---|
| ArgC MSlow |
 |
|---|
| LysN MSlow |
 |
|---|
| TryLysC MSlow |
 |
|---|
| Try MShigh |
 |
|---|
| ChTry MShigh |
 |
|---|
| ArgC MShigh |
 |
|---|
| LysN MShigh |
 |
|---|
| TryLysC MShigh |
 |
|---|
General Statistics
Number of major isoforms |
Number of additional isoforms |
Number of all proteins |
Number of amino acids |
Min. Seq. Length |
Max. Seq. Length |
Avg. Seq. Length |
Avg. Mol. Weight |
|---|---|---|---|---|---|---|---|
0 |
3337 |
133 |
2329 |
834.3 |
94.47 |
Amino acid frequency
Ala |
Cys |
Asp |
Glu |
Phe |
Gly |
His |
Ile |
Lys |
Leu |
|---|---|---|---|---|---|---|---|---|---|
6.593 ± 1.11 | 1.738 ± 0.382 |
5.634 ± 0.364 | 5.394 ± 0.891 |
5.634 ± 0.284 | 5.274 ± 0.442 |
2.068 ± 0.363 | 7.971 ± 1.062 |
6.922 ± 1.367 | 7.911 ± 0.484 |
Met |
Asn |
Gln |
Pro |
Arg |
Ser |
Thr |
Val |
Trp |
Tyr |
|---|---|---|---|---|---|---|---|---|---|
2.607 ± 0.279 | 6.233 ± 0.975 |
4.915 ± 0.231 | 4.195 ± 0.688 |
3.596 ± 0.698 | 7.312 ± 0.354 |
4.885 ± 0.603 | 5.814 ± 0.851 |
1.259 ± 0.055 | 4.046 ± 0.396 |
Most of the basic statistics you can see at this page can be downloaded from this CSV file
Proteome-pI is available under Creative Commons Attribution-NoDerivs license, for more details see here
| Reference: Kozlowski LP. Proteome-pI 2.0: Proteome Isoelectric Point Database Update. Nucleic Acids Res. 2021, doi: 10.1093/nar/gkab944 | Contact: Lukasz P. Kozlowski |
