Varroa mite associated genomovirus 1
Taxonomy: Viruses; Monodnaviria; Shotokuvirae; Cressdnaviricota; Repensiviricetes; Geplafuvirales; Genomoviridae; unclassified Genomoviridae
Average proteome isoelectric point is 6.57
Get precalculated fractions of proteins

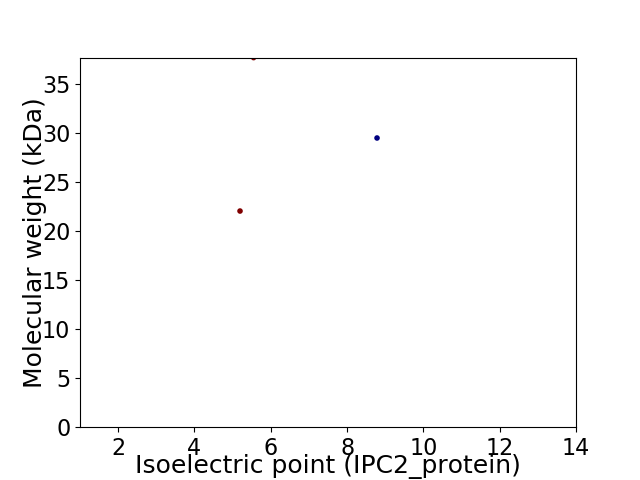
Virtual 2D-PAGE plot for 3 proteins (isoelectric point calculated using IPC2_protein)
Get csv file with sequences according to given criteria:
* You can choose from 21 different methods for calculating isoelectric point
Summary statistics related to proteome-wise predictions


Protein with the lowest isoelectric point:
>tr|A0A2I8B2L9|A0A2I8B2L9_9VIRU Capsid protein OS=Varroa mite associated genomovirus 1 OX=2077299 PE=4 SV=1
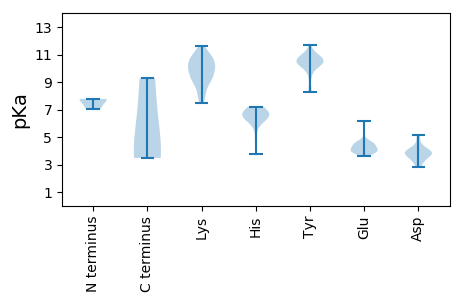
MM1 pKa = 7.77PSAFHH6 pKa = 6.55LKK8 pKa = 9.2NRR10 pKa = 11.84RR11 pKa = 11.84YY12 pKa = 10.59VLFTYY17 pKa = 10.25SQAGPDD23 pKa = 3.36FDD25 pKa = 3.8YY26 pKa = 10.74WAVVDD31 pKa = 5.11LLGDD35 pKa = 4.08LGAEE39 pKa = 3.99CVIGRR44 pKa = 11.84EE45 pKa = 3.95EE46 pKa = 3.96HH47 pKa = 6.75ADD49 pKa = 3.49GGIHH53 pKa = 5.86FHH55 pKa = 6.37VFTDD59 pKa = 4.01FGRR62 pKa = 11.84LFSTRR67 pKa = 11.84KK68 pKa = 9.62VRR70 pKa = 11.84VFDD73 pKa = 4.04VGGKK77 pKa = 9.28HH78 pKa = 6.77PNIQPIGRR86 pKa = 11.84TPATAYY92 pKa = 10.46DD93 pKa = 3.92YY94 pKa = 10.93AIKK97 pKa = 10.92DD98 pKa = 3.52GDD100 pKa = 4.04VVAGGLGRR108 pKa = 11.84PGGDD112 pKa = 4.46CDD114 pKa = 3.84WDD116 pKa = 3.81PDD118 pKa = 4.21NFWSSAAHH126 pKa = 6.35CGSSDD131 pKa = 3.73EE132 pKa = 4.63FLHH135 pKa = 7.2FCDD138 pKa = 4.74QLATRR143 pKa = 11.84DD144 pKa = 4.14LIKK147 pKa = 10.71SFPNFRR153 pKa = 11.84AYY155 pKa = 10.47ANWKK159 pKa = 7.95WNSGVPEE166 pKa = 3.98YY167 pKa = 10.39DD168 pKa = 3.22QPAGAIFDD176 pKa = 3.85TSAAPGIDD184 pKa = 3.0EE185 pKa = 4.61WLSQSALGTGKK196 pKa = 10.2SRR198 pKa = 11.84ARR200 pKa = 3.48
MM1 pKa = 7.77PSAFHH6 pKa = 6.55LKK8 pKa = 9.2NRR10 pKa = 11.84RR11 pKa = 11.84YY12 pKa = 10.59VLFTYY17 pKa = 10.25SQAGPDD23 pKa = 3.36FDD25 pKa = 3.8YY26 pKa = 10.74WAVVDD31 pKa = 5.11LLGDD35 pKa = 4.08LGAEE39 pKa = 3.99CVIGRR44 pKa = 11.84EE45 pKa = 3.95EE46 pKa = 3.96HH47 pKa = 6.75ADD49 pKa = 3.49GGIHH53 pKa = 5.86FHH55 pKa = 6.37VFTDD59 pKa = 4.01FGRR62 pKa = 11.84LFSTRR67 pKa = 11.84KK68 pKa = 9.62VRR70 pKa = 11.84VFDD73 pKa = 4.04VGGKK77 pKa = 9.28HH78 pKa = 6.77PNIQPIGRR86 pKa = 11.84TPATAYY92 pKa = 10.46DD93 pKa = 3.92YY94 pKa = 10.93AIKK97 pKa = 10.92DD98 pKa = 3.52GDD100 pKa = 4.04VVAGGLGRR108 pKa = 11.84PGGDD112 pKa = 4.46CDD114 pKa = 3.84WDD116 pKa = 3.81PDD118 pKa = 4.21NFWSSAAHH126 pKa = 6.35CGSSDD131 pKa = 3.73EE132 pKa = 4.63FLHH135 pKa = 7.2FCDD138 pKa = 4.74QLATRR143 pKa = 11.84DD144 pKa = 4.14LIKK147 pKa = 10.71SFPNFRR153 pKa = 11.84AYY155 pKa = 10.47ANWKK159 pKa = 7.95WNSGVPEE166 pKa = 3.98YY167 pKa = 10.39DD168 pKa = 3.22QPAGAIFDD176 pKa = 3.85TSAAPGIDD184 pKa = 3.0EE185 pKa = 4.61WLSQSALGTGKK196 pKa = 10.2SRR198 pKa = 11.84ARR200 pKa = 3.48
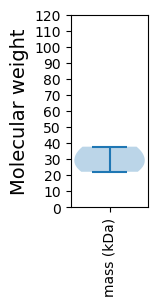
Molecular weight: 22.05 kDa
Isoelectric point according different methods:
Protein with the highest isoelectric point:
>tr|A0A2I8B2L9|A0A2I8B2L9_9VIRU Capsid protein OS=Varroa mite associated genomovirus 1 OX=2077299 PE=4 SV=1
MM1 pKa = 7.07SSKK4 pKa = 10.7RR5 pKa = 11.84ILNLTSTKK13 pKa = 10.4KK14 pKa = 10.23KK15 pKa = 10.86DD16 pKa = 3.66VMLQYY21 pKa = 11.06TNIDD25 pKa = 3.73FGSISPGAYY34 pKa = 8.41NQKK37 pKa = 9.06EE38 pKa = 3.75AAMTGNFRR46 pKa = 11.84YY47 pKa = 8.31MIPWIATGRR56 pKa = 11.84PGIDD60 pKa = 2.84ISGGGAGPIDD70 pKa = 3.74EE71 pKa = 4.48STRR74 pKa = 11.84TKK76 pKa = 7.5TTCFMRR82 pKa = 11.84GLKK85 pKa = 10.18EE86 pKa = 4.45SITLRR91 pKa = 11.84SGDD94 pKa = 3.67GQPWLWRR101 pKa = 11.84RR102 pKa = 11.84ICFTLKK108 pKa = 9.95GDD110 pKa = 5.02RR111 pKa = 11.84IHH113 pKa = 6.77SLQAAGMNLYY123 pKa = 10.29DD124 pKa = 3.87RR125 pKa = 11.84QNGAGASGVIRR136 pKa = 11.84PATNWPATTPGGAEE150 pKa = 4.06LEE152 pKa = 4.07QLMFRR157 pKa = 11.84GVRR160 pKa = 11.84NIDD163 pKa = 3.14WADD166 pKa = 3.36SFLAPLDD173 pKa = 3.48STRR176 pKa = 11.84ISVKK180 pKa = 9.94YY181 pKa = 10.78DD182 pKa = 2.85KK183 pKa = 8.59TTTLASGNSEE193 pKa = 3.93GFIRR197 pKa = 11.84TYY199 pKa = 10.82HH200 pKa = 6.44RR201 pKa = 11.84WHH203 pKa = 7.17PMNKK207 pKa = 9.09NLVYY211 pKa = 10.83GDD213 pKa = 4.2DD214 pKa = 3.69QNGQSVQLTPWSTEE228 pKa = 3.64GKK230 pKa = 9.96QGMGDD235 pKa = 4.0FYY237 pKa = 11.72VVDD240 pKa = 4.38LFKK243 pKa = 11.61SNGNPDD249 pKa = 3.22AQLGLRR255 pKa = 11.84YY256 pKa = 9.73NATLYY261 pKa = 9.25WHH263 pKa = 7.02EE264 pKa = 4.27KK265 pKa = 9.3
MM1 pKa = 7.07SSKK4 pKa = 10.7RR5 pKa = 11.84ILNLTSTKK13 pKa = 10.4KK14 pKa = 10.23KK15 pKa = 10.86DD16 pKa = 3.66VMLQYY21 pKa = 11.06TNIDD25 pKa = 3.73FGSISPGAYY34 pKa = 8.41NQKK37 pKa = 9.06EE38 pKa = 3.75AAMTGNFRR46 pKa = 11.84YY47 pKa = 8.31MIPWIATGRR56 pKa = 11.84PGIDD60 pKa = 2.84ISGGGAGPIDD70 pKa = 3.74EE71 pKa = 4.48STRR74 pKa = 11.84TKK76 pKa = 7.5TTCFMRR82 pKa = 11.84GLKK85 pKa = 10.18EE86 pKa = 4.45SITLRR91 pKa = 11.84SGDD94 pKa = 3.67GQPWLWRR101 pKa = 11.84RR102 pKa = 11.84ICFTLKK108 pKa = 9.95GDD110 pKa = 5.02RR111 pKa = 11.84IHH113 pKa = 6.77SLQAAGMNLYY123 pKa = 10.29DD124 pKa = 3.87RR125 pKa = 11.84QNGAGASGVIRR136 pKa = 11.84PATNWPATTPGGAEE150 pKa = 4.06LEE152 pKa = 4.07QLMFRR157 pKa = 11.84GVRR160 pKa = 11.84NIDD163 pKa = 3.14WADD166 pKa = 3.36SFLAPLDD173 pKa = 3.48STRR176 pKa = 11.84ISVKK180 pKa = 9.94YY181 pKa = 10.78DD182 pKa = 2.85KK183 pKa = 8.59TTTLASGNSEE193 pKa = 3.93GFIRR197 pKa = 11.84TYY199 pKa = 10.82HH200 pKa = 6.44RR201 pKa = 11.84WHH203 pKa = 7.17PMNKK207 pKa = 9.09NLVYY211 pKa = 10.83GDD213 pKa = 4.2DD214 pKa = 3.69QNGQSVQLTPWSTEE228 pKa = 3.64GKK230 pKa = 9.96QGMGDD235 pKa = 4.0FYY237 pKa = 11.72VVDD240 pKa = 4.38LFKK243 pKa = 11.61SNGNPDD249 pKa = 3.22AQLGLRR255 pKa = 11.84YY256 pKa = 9.73NATLYY261 pKa = 9.25WHH263 pKa = 7.02EE264 pKa = 4.27KK265 pKa = 9.3
Molecular weight: 29.51 kDa
Isoelectric point according different methods:
Peptides (in silico digests for buttom-up proteomics)
Below you can find in silico digests of the whole proteome with Trypsin, Chymotrypsin, Trypsin+LysC, LysN, ArgC proteases suitable for different mass spec machines.| Try ESI |
 |
|---|
| ChTry ESI |
 |
|---|
| ArgC ESI |
 |
|---|
| LysN ESI |
 |
|---|
| TryLysC ESI |
 |
|---|
| Try MALDI |
 |
|---|
| ChTry MALDI |
 |
|---|
| ArgC MALDI |
 |
|---|
| LysN MALDI |
 |
|---|
| TryLysC MALDI |
 |
|---|
| Try LTQ |
 |
|---|
| ChTry LTQ |
 |
|---|
| ArgC LTQ |
 |
|---|
| LysN LTQ |
 |
|---|
| TryLysC LTQ |
 |
|---|
| Try MSlow |
 |
|---|
| ChTry MSlow |
 |
|---|
| ArgC MSlow |
 |
|---|
| LysN MSlow |
 |
|---|
| TryLysC MSlow |
 |
|---|
| Try MShigh |
 |
|---|
| ChTry MShigh |
 |
|---|
| ArgC MShigh |
 |
|---|
| LysN MShigh |
 |
|---|
| TryLysC MShigh |
 |
|---|
General Statistics
Number of major isoforms |
Number of additional isoforms |
Number of all proteins |
Number of amino acids |
Min. Seq. Length |
Max. Seq. Length |
Avg. Seq. Length |
Avg. Mol. Weight |
|---|---|---|---|---|---|---|---|
0 |
799 |
200 |
334 |
266.3 |
29.76 |
Amino acid frequency
Ala |
Cys |
Asp |
Glu |
Phe |
Gly |
His |
Ile |
Lys |
Leu |
|---|---|---|---|---|---|---|---|---|---|
8.26 ± 0.787 | 1.502 ± 0.317 |
8.26 ± 0.939 | 3.504 ± 0.361 |
5.507 ± 0.893 | 10.638 ± 0.24 |
3.004 ± 0.67 | 4.631 ± 0.439 |
4.255 ± 0.435 | 7.259 ± 0.371 |
Met |
Asn |
Gln |
Pro |
Arg |
Ser |
Thr |
Val |
Trp |
Tyr |
|---|---|---|---|---|---|---|---|---|---|
1.627 ± 0.752 | 3.63 ± 0.915 |
4.881 ± 0.19 | 3.004 ± 0.502 |
6.508 ± 0.2 | 6.508 ± 0.327 |
5.382 ± 1.269 | 4.631 ± 0.693 |
3.63 ± 0.453 | 3.379 ± 0.22 |
Most of the basic statistics you can see at this page can be downloaded from this CSV file
Proteome-pI is available under Creative Commons Attribution-NoDerivs license, for more details see here
| Reference: Kozlowski LP. Proteome-pI 2.0: Proteome Isoelectric Point Database Update. Nucleic Acids Res. 2021, doi: 10.1093/nar/gkab944 | Contact: Lukasz P. Kozlowski |
