Clostridium sp. CAG:575
Taxonomy: cellular organisms; Bacteria; Terrabacteria group; Firmicutes; Clostridia; Eubacteriales; Clostridiaceae; Clostridium; environmental samples
Average proteome isoelectric point is 6.53
Get precalculated fractions of proteins
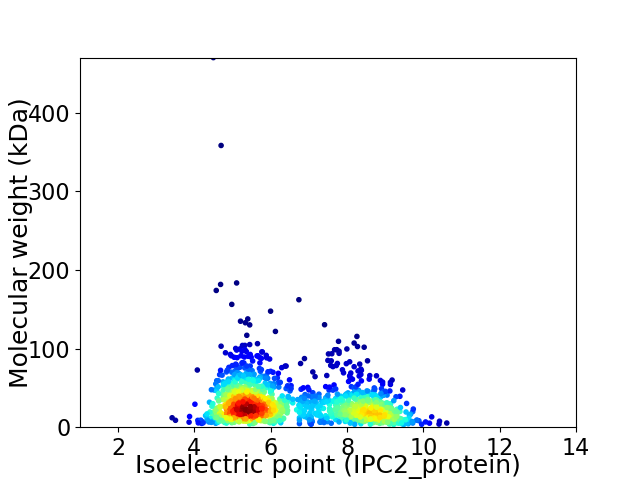
Virtual 2D-PAGE plot for 1338 proteins (isoelectric point calculated using IPC2_protein)
Get csv file with sequences according to given criteria:
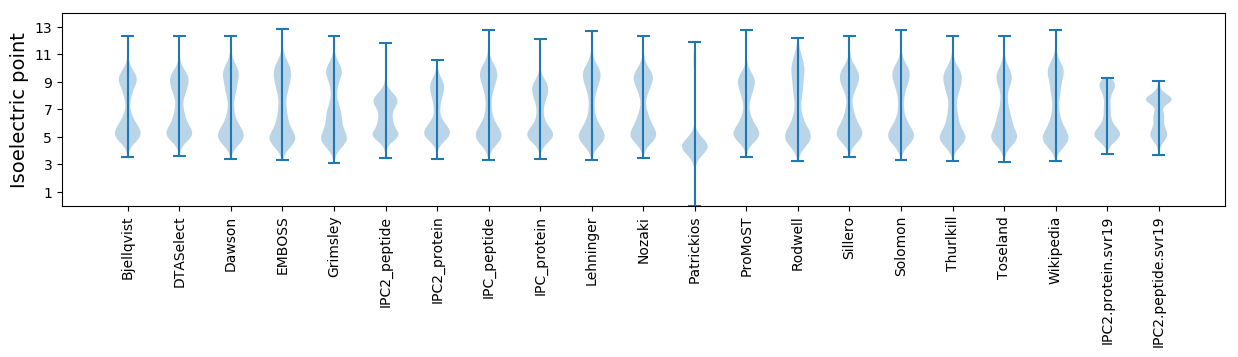
* You can choose from 21 different methods for calculating isoelectric point
Summary statistics related to proteome-wise predictions
Protein with the lowest isoelectric point:
>tr|R6I0W2|R6I0W2_9CLOT Uncharacterized protein OS=Clostridium sp. CAG:575 OX=1262823 GN=BN717_00849 PE=3 SV=1
MM1 pKa = 7.58SEE3 pKa = 4.39SNLNEE8 pKa = 4.07QIEE11 pKa = 4.33NLLKK15 pKa = 10.43EE16 pKa = 4.08MKK18 pKa = 9.85EE19 pKa = 3.59IKK21 pKa = 10.04EE22 pKa = 4.13NQKK25 pKa = 10.6EE26 pKa = 4.23MTEE29 pKa = 4.37KK30 pKa = 9.58MSKK33 pKa = 7.05MQQVIDD39 pKa = 4.77HH40 pKa = 6.92IEE42 pKa = 3.7SDD44 pKa = 3.31IYY46 pKa = 11.31ADD48 pKa = 3.37EE49 pKa = 5.05GFDD52 pKa = 4.16FEE54 pKa = 5.45IVCPYY59 pKa = 10.15CEE61 pKa = 4.25HH62 pKa = 6.85EE63 pKa = 4.45FVIDD67 pKa = 3.45ADD69 pKa = 4.05EE70 pKa = 4.54NKK72 pKa = 10.94DD73 pKa = 3.66EE74 pKa = 4.8IEE76 pKa = 4.5CPEE79 pKa = 4.29CKK81 pKa = 10.45NIIEE85 pKa = 4.95LDD87 pKa = 3.12WSGDD91 pKa = 3.52IEE93 pKa = 4.21EE94 pKa = 5.64HH95 pKa = 6.94EE96 pKa = 5.1DD97 pKa = 3.62GCSGHH102 pKa = 6.86CCGCAGCDD110 pKa = 4.82DD111 pKa = 4.98EE112 pKa = 7.14DD113 pKa = 5.89NEE115 pKa = 5.81DD116 pKa = 4.68DD117 pKa = 3.59MM118 pKa = 7.93
MM1 pKa = 7.58SEE3 pKa = 4.39SNLNEE8 pKa = 4.07QIEE11 pKa = 4.33NLLKK15 pKa = 10.43EE16 pKa = 4.08MKK18 pKa = 9.85EE19 pKa = 3.59IKK21 pKa = 10.04EE22 pKa = 4.13NQKK25 pKa = 10.6EE26 pKa = 4.23MTEE29 pKa = 4.37KK30 pKa = 9.58MSKK33 pKa = 7.05MQQVIDD39 pKa = 4.77HH40 pKa = 6.92IEE42 pKa = 3.7SDD44 pKa = 3.31IYY46 pKa = 11.31ADD48 pKa = 3.37EE49 pKa = 5.05GFDD52 pKa = 4.16FEE54 pKa = 5.45IVCPYY59 pKa = 10.15CEE61 pKa = 4.25HH62 pKa = 6.85EE63 pKa = 4.45FVIDD67 pKa = 3.45ADD69 pKa = 4.05EE70 pKa = 4.54NKK72 pKa = 10.94DD73 pKa = 3.66EE74 pKa = 4.8IEE76 pKa = 4.5CPEE79 pKa = 4.29CKK81 pKa = 10.45NIIEE85 pKa = 4.95LDD87 pKa = 3.12WSGDD91 pKa = 3.52IEE93 pKa = 4.21EE94 pKa = 5.64HH95 pKa = 6.94EE96 pKa = 5.1DD97 pKa = 3.62GCSGHH102 pKa = 6.86CCGCAGCDD110 pKa = 4.82DD111 pKa = 4.98EE112 pKa = 7.14DD113 pKa = 5.89NEE115 pKa = 5.81DD116 pKa = 4.68DD117 pKa = 3.59MM118 pKa = 7.93
Molecular weight: 13.64 kDa
Isoelectric point according different methods:
Protein with the highest isoelectric point:
>tr|R6HDL0|R6HDL0_9CLOT Uncharacterized protein OS=Clostridium sp. CAG:575 OX=1262823 GN=BN717_01130 PE=4 SV=1
MM1 pKa = 6.9VGKK4 pKa = 10.19RR5 pKa = 11.84RR6 pKa = 11.84NLLNYY11 pKa = 9.3LAKK14 pKa = 10.31KK15 pKa = 10.17DD16 pKa = 3.57VQRR19 pKa = 11.84YY20 pKa = 8.35RR21 pKa = 11.84DD22 pKa = 3.51IVEE25 pKa = 3.92KK26 pKa = 10.99LGLRR30 pKa = 11.84KK31 pKa = 9.66
MM1 pKa = 6.9VGKK4 pKa = 10.19RR5 pKa = 11.84RR6 pKa = 11.84NLLNYY11 pKa = 9.3LAKK14 pKa = 10.31KK15 pKa = 10.17DD16 pKa = 3.57VQRR19 pKa = 11.84YY20 pKa = 8.35RR21 pKa = 11.84DD22 pKa = 3.51IVEE25 pKa = 3.92KK26 pKa = 10.99LGLRR30 pKa = 11.84KK31 pKa = 9.66
Molecular weight: 3.77 kDa
Isoelectric point according different methods:
Peptides (in silico digests for buttom-up proteomics)
Below you can find in silico digests of the whole proteome with Trypsin, Chymotrypsin, Trypsin+LysC, LysN, ArgC proteases suitable for different mass spec machines.| Try ESI |
 |
|---|
| ChTry ESI |
|
|---|
| ArgC ESI |
|
|---|
| LysN ESI |
|
|---|
| TryLysC ESI |
|
|---|
| Try MALDI |
|
|---|
| ChTry MALDI |
|
|---|
| ArgC MALDI |
|
|---|
| LysN MALDI |
|
|---|
| TryLysC MALDI |
|
|---|
| Try LTQ |
|
|---|
| ChTry LTQ |
|
|---|
| ArgC LTQ |
|
|---|
| LysN LTQ |
|
|---|
| TryLysC LTQ |
|
|---|
| Try MSlow |
|
|---|
| ChTry MSlow |
|
|---|
| ArgC MSlow |
|
|---|
| LysN MSlow |
|
|---|
| TryLysC MSlow |
|
|---|
| Try MShigh |
|
|---|
| ChTry MShigh |
|
|---|
| ArgC MShigh |
|
|---|
| LysN MShigh |
|
|---|
| TryLysC MShigh |
|
|---|
General Statistics
Number of major isoforms |
Number of additional isoforms |
Number of all proteins |
Number of amino acids |
Min. Seq. Length |
Max. Seq. Length |
Avg. Seq. Length |
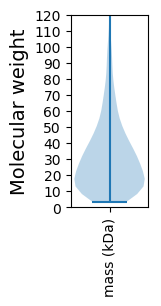
Avg. Mol. Weight |
|---|---|---|---|---|---|---|---|
0 |
387873 |
30 |
4217 |
289.9 |
33.05 |
Amino acid frequency
Ala |
Cys |
Asp |
Glu |
Phe |
Gly |
His |
Ile |
Lys |
Leu |
|---|---|---|---|---|---|---|---|---|---|
4.967 ± 0.059 | 1.082 ± 0.027 |
5.571 ± 0.08 | 8.351 ± 0.087 |
3.859 ± 0.062 | 5.655 ± 0.06 |
1.146 ± 0.025 | 10.483 ± 0.096 |
10.131 ± 0.073 | 8.183 ± 0.078 |
Met |
Asn |
Gln |
Pro |
Arg |
Ser |
Thr |
Val |
Trp |
Tyr |
|---|---|---|---|---|---|---|---|---|---|
2.402 ± 0.038 | 7.216 ± 0.092 |
2.438 ± 0.036 | 2.987 ± 0.038 |
3.12 ± 0.047 | 5.625 ± 0.056 |
5.766 ± 0.088 | 5.886 ± 0.05 |
0.656 ± 0.02 | 4.468 ± 0.05 |
Most of the basic statistics you can see at this page can be downloaded from this CSV file
See this proteome in:

Proteome-pI is available under Creative Commons Attribution-NoDerivs license, for more details see here
| Reference: Kozlowski LP. Proteome-pI 2.0: Proteome Isoelectric Point Database Update. Nucleic Acids Res. 2021, doi: 10.1093/nar/gkab944 | Contact: Lukasz P. Kozlowski |