Blastococcus sp. AZ43
Taxonomy: cellular organisms; Bacteria; Terrabacteria group; Actinobacteria; Actinomycetia; Geodermatophilales; Geodermatophilaceae; Blastococcus; unclassified Blastococcus
Average proteome isoelectric point is 6.08
Get precalculated fractions of proteins

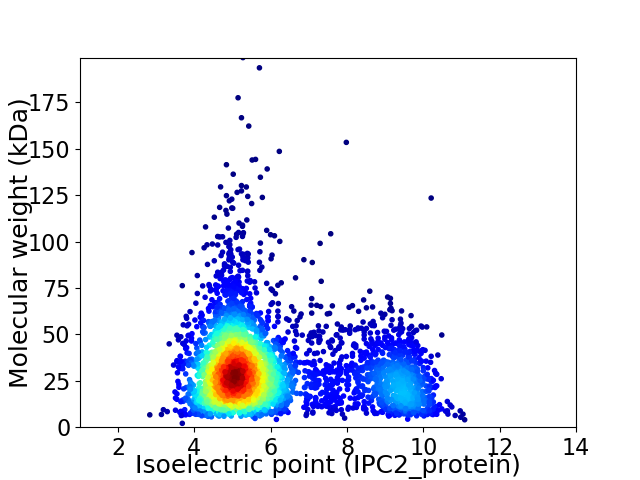
Virtual 2D-PAGE plot for 3926 proteins (isoelectric point calculated using IPC2_protein)
Get csv file with sequences according to given criteria:
* You can choose from 21 different methods for calculating isoelectric point
Summary statistics related to proteome-wise predictions


Protein with the lowest isoelectric point:
>tr|A0A4Y9NDR5|A0A4Y9NDR5_9ACTN Uncharacterized protein OS=Blastococcus sp. AZ43 OX=2559606 GN=E4P37_10640 PE=4 SV=1
MM1 pKa = 7.91SYY3 pKa = 10.46PPQAPHH9 pKa = 5.45QQYY12 pKa = 10.61GPPPSYY18 pKa = 10.94APPPKK23 pKa = 9.99QGAGLAIASMVLGIIALLLSWIPIINNVAAVIALVGLGLGIPALLRR69 pKa = 11.84ARR71 pKa = 11.84RR72 pKa = 11.84GTHH75 pKa = 5.9SGTGMAITGLVTSVIAIVLVILTQLLFVEE104 pKa = 5.66AIEE107 pKa = 4.19EE108 pKa = 4.27VEE110 pKa = 3.98KK111 pKa = 11.08SINEE115 pKa = 4.44GIEE118 pKa = 3.94QSEE121 pKa = 5.06LDD123 pKa = 3.93PADD126 pKa = 3.61PTAEE130 pKa = 4.0AEE132 pKa = 4.42EE133 pKa = 4.45PVAAPEE139 pKa = 4.05VVPLGAPAQVGDD151 pKa = 3.81YY152 pKa = 10.29EE153 pKa = 4.84VIVDD157 pKa = 4.97AVEE160 pKa = 4.18LDD162 pKa = 3.73ANATVAAANDD172 pKa = 4.05FNEE175 pKa = 4.7PPAGQYY181 pKa = 10.8VITQLTVTYY190 pKa = 9.17TGTDD194 pKa = 2.81EE195 pKa = 6.11GMPGWDD201 pKa = 3.21LTAVFHH207 pKa = 6.31GTDD210 pKa = 2.9NRR212 pKa = 11.84QYY214 pKa = 11.65SDD216 pKa = 3.89TEE218 pKa = 4.2CSAVLPDD225 pKa = 4.85DD226 pKa = 5.7AMDD229 pKa = 4.94APTLNPGGVDD239 pKa = 3.28TFQFCMDD246 pKa = 4.37VAPTAIPGGQLTIEE260 pKa = 4.29PTVSFGSDD268 pKa = 2.82EE269 pKa = 4.1RR270 pKa = 11.84VAFAIQQ276 pKa = 2.86
MM1 pKa = 7.91SYY3 pKa = 10.46PPQAPHH9 pKa = 5.45QQYY12 pKa = 10.61GPPPSYY18 pKa = 10.94APPPKK23 pKa = 9.99QGAGLAIASMVLGIIALLLSWIPIINNVAAVIALVGLGLGIPALLRR69 pKa = 11.84ARR71 pKa = 11.84RR72 pKa = 11.84GTHH75 pKa = 5.9SGTGMAITGLVTSVIAIVLVILTQLLFVEE104 pKa = 5.66AIEE107 pKa = 4.19EE108 pKa = 4.27VEE110 pKa = 3.98KK111 pKa = 11.08SINEE115 pKa = 4.44GIEE118 pKa = 3.94QSEE121 pKa = 5.06LDD123 pKa = 3.93PADD126 pKa = 3.61PTAEE130 pKa = 4.0AEE132 pKa = 4.42EE133 pKa = 4.45PVAAPEE139 pKa = 4.05VVPLGAPAQVGDD151 pKa = 3.81YY152 pKa = 10.29EE153 pKa = 4.84VIVDD157 pKa = 4.97AVEE160 pKa = 4.18LDD162 pKa = 3.73ANATVAAANDD172 pKa = 4.05FNEE175 pKa = 4.7PPAGQYY181 pKa = 10.8VITQLTVTYY190 pKa = 9.17TGTDD194 pKa = 2.81EE195 pKa = 6.11GMPGWDD201 pKa = 3.21LTAVFHH207 pKa = 6.31GTDD210 pKa = 2.9NRR212 pKa = 11.84QYY214 pKa = 11.65SDD216 pKa = 3.89TEE218 pKa = 4.2CSAVLPDD225 pKa = 4.85DD226 pKa = 5.7AMDD229 pKa = 4.94APTLNPGGVDD239 pKa = 3.28TFQFCMDD246 pKa = 4.37VAPTAIPGGQLTIEE260 pKa = 4.29PTVSFGSDD268 pKa = 2.82EE269 pKa = 4.1RR270 pKa = 11.84VAFAIQQ276 pKa = 2.86
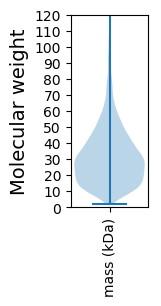
Molecular weight: 28.71 kDa
Isoelectric point according different methods:
Protein with the highest isoelectric point:
>tr|A0A4Y9N748|A0A4Y9N748_9ACTN ATP-binding protein OS=Blastococcus sp. AZ43 OX=2559606 GN=E4P37_14825 PE=3 SV=1
MM1 pKa = 7.4GSVIKK6 pKa = 10.42KK7 pKa = 8.47RR8 pKa = 11.84RR9 pKa = 11.84KK10 pKa = 9.22RR11 pKa = 11.84MAKK14 pKa = 9.41KK15 pKa = 9.99KK16 pKa = 9.77HH17 pKa = 5.81RR18 pKa = 11.84KK19 pKa = 8.51LLKK22 pKa = 8.15KK23 pKa = 9.25TRR25 pKa = 11.84VQRR28 pKa = 11.84RR29 pKa = 11.84NKK31 pKa = 9.81KK32 pKa = 9.63
MM1 pKa = 7.4GSVIKK6 pKa = 10.42KK7 pKa = 8.47RR8 pKa = 11.84RR9 pKa = 11.84KK10 pKa = 9.22RR11 pKa = 11.84MAKK14 pKa = 9.41KK15 pKa = 9.99KK16 pKa = 9.77HH17 pKa = 5.81RR18 pKa = 11.84KK19 pKa = 8.51LLKK22 pKa = 8.15KK23 pKa = 9.25TRR25 pKa = 11.84VQRR28 pKa = 11.84RR29 pKa = 11.84NKK31 pKa = 9.81KK32 pKa = 9.63
Molecular weight: 4.02 kDa
Isoelectric point according different methods:
Peptides (in silico digests for buttom-up proteomics)
Below you can find in silico digests of the whole proteome with Trypsin, Chymotrypsin, Trypsin+LysC, LysN, ArgC proteases suitable for different mass spec machines.| Try ESI |
 |
|---|
| ChTry ESI |
 |
|---|
| ArgC ESI |
 |
|---|
| LysN ESI |
 |
|---|
| TryLysC ESI |
 |
|---|
| Try MALDI |
 |
|---|
| ChTry MALDI |
 |
|---|
| ArgC MALDI |
 |
|---|
| LysN MALDI |
 |
|---|
| TryLysC MALDI |
 |
|---|
| Try LTQ |
 |
|---|
| ChTry LTQ |
 |
|---|
| ArgC LTQ |
 |
|---|
| LysN LTQ |
 |
|---|
| TryLysC LTQ |
 |
|---|
| Try MSlow |
 |
|---|
| ChTry MSlow |
 |
|---|
| ArgC MSlow |
 |
|---|
| LysN MSlow |
 |
|---|
| TryLysC MSlow |
 |
|---|
| Try MShigh |
 |
|---|
| ChTry MShigh |
 |
|---|
| ArgC MShigh |
 |
|---|
| LysN MShigh |
 |
|---|
| TryLysC MShigh |
 |
|---|
General Statistics
Number of major isoforms |
Number of additional isoforms |
Number of all proteins |
Number of amino acids |
Min. Seq. Length |
Max. Seq. Length |
Avg. Seq. Length |
Avg. Mol. Weight |
|---|---|---|---|---|---|---|---|
0 |
1219815 |
19 |
1870 |
310.7 |
33.03 |
Amino acid frequency
Ala |
Cys |
Asp |
Glu |
Phe |
Gly |
His |
Ile |
Lys |
Leu |
|---|---|---|---|---|---|---|---|---|---|
14.186 ± 0.065 | 0.677 ± 0.01 |
6.26 ± 0.029 | 5.779 ± 0.037 |
2.613 ± 0.021 | 9.596 ± 0.035 |
1.967 ± 0.019 | 3.004 ± 0.029 |
1.492 ± 0.024 | 10.719 ± 0.043 |
Met |
Asn |
Gln |
Pro |
Arg |
Ser |
Thr |
Val |
Trp |
Tyr |
|---|---|---|---|---|---|---|---|---|---|
1.684 ± 0.015 | 1.472 ± 0.019 |
6.125 ± 0.031 | 2.663 ± 0.02 |
8.126 ± 0.04 | 4.804 ± 0.026 |
5.865 ± 0.027 | 9.72 ± 0.036 |
1.482 ± 0.016 | 1.767 ± 0.018 |
Most of the basic statistics you can see at this page can be downloaded from this CSV file
Proteome-pI is available under Creative Commons Attribution-NoDerivs license, for more details see here
| Reference: Kozlowski LP. Proteome-pI 2.0: Proteome Isoelectric Point Database Update. Nucleic Acids Res. 2021, doi: 10.1093/nar/gkab944 | Contact: Lukasz P. Kozlowski |
