Aspergillus glaucus CBS 516.65
Taxonomy: cellular organisms; Eukaryota; Opisthokonta; Fungi; Dikarya; Ascomycota; saccharomyceta; Pezizomycotina; leotiomyceta; Eurotiomycetes; Eurotiomycetidae; Eurotiales; Aspergillaceae; Aspergillus; Aspergillus subgen. Aspergillus; Aspergillus glaucus
Average proteome isoelectric point is 6.4
Get precalculated fractions of proteins

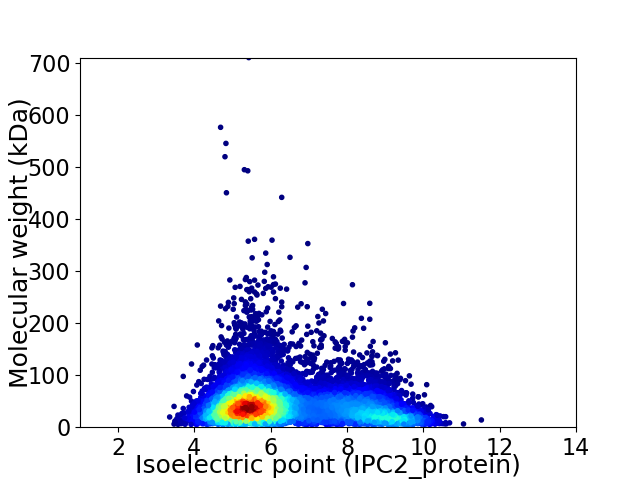
Virtual 2D-PAGE plot for 11245 proteins (isoelectric point calculated using IPC2_protein)
Get csv file with sequences according to given criteria:
* You can choose from 21 different methods for calculating isoelectric point
Summary statistics related to proteome-wise predictions


Protein with the lowest isoelectric point:
>tr|A0A1L9VNY5|A0A1L9VNY5_ASPGL Uncharacterized protein OS=Aspergillus glaucus CBS 516.65 OX=1160497 GN=ASPGLDRAFT_1373063 PE=4 SV=1
MM1 pKa = 7.77VYY3 pKa = 8.76GTQNEE8 pKa = 4.13DD9 pKa = 3.54PEE11 pKa = 5.31RR12 pKa = 11.84GEE14 pKa = 3.96YY15 pKa = 9.95RR16 pKa = 11.84SLYY19 pKa = 10.15SDD21 pKa = 3.46QDD23 pKa = 3.61GDD25 pKa = 4.25DD26 pKa = 4.14TPSTTPLYY34 pKa = 8.29THH36 pKa = 7.68PSTAPNANNPEE47 pKa = 4.37FMSKK51 pKa = 10.15PNPRR55 pKa = 11.84RR56 pKa = 11.84RR57 pKa = 11.84SWIQFQQNLRR67 pKa = 11.84LPTSTEE73 pKa = 3.52VSTIAKK79 pKa = 9.87AVFGALGFIIGILVCTLAIITLIYY103 pKa = 10.53GCTEE107 pKa = 3.75VVNSIRR113 pKa = 11.84HH114 pKa = 5.18VDD116 pKa = 3.62DD117 pKa = 4.31PSPYY121 pKa = 9.93RR122 pKa = 11.84RR123 pKa = 11.84LSDD126 pKa = 3.49YY127 pKa = 10.41QGYY130 pKa = 8.47VAVEE134 pKa = 4.1DD135 pKa = 5.84DD136 pKa = 4.19IDD138 pKa = 4.2DD139 pKa = 4.9PYY141 pKa = 10.53PYY143 pKa = 9.62PYY145 pKa = 10.32SYY147 pKa = 10.91PLTDD151 pKa = 3.47GGGDD155 pKa = 3.21VDD157 pKa = 4.22TAPKK161 pKa = 11.09AMTTKK166 pKa = 10.49SGIEE170 pKa = 3.88VACFGEE176 pKa = 4.71AGTCEE181 pKa = 4.04ASLSEE186 pKa = 5.05LMRR189 pKa = 11.84IPQATRR195 pKa = 11.84VAVITDD201 pKa = 3.64GEE203 pKa = 4.25AWSDD207 pKa = 3.21ITGEE211 pKa = 4.32DD212 pKa = 3.63LDD214 pKa = 5.54GDD216 pKa = 3.89VDD218 pKa = 4.03IDD220 pKa = 4.0GDD222 pKa = 3.98GDD224 pKa = 3.73GDD226 pKa = 3.57EE227 pKa = 5.84GEE229 pKa = 4.89FPDD232 pKa = 5.72EE233 pKa = 4.02LACGNMWMEE242 pKa = 4.1EE243 pKa = 4.1DD244 pKa = 3.37EE245 pKa = 4.58GVVVDD250 pKa = 3.85EE251 pKa = 4.83LEE253 pKa = 4.28YY254 pKa = 11.39VSMLDD259 pKa = 3.73RR260 pKa = 11.84LWNGLFGGG268 pKa = 4.35
MM1 pKa = 7.77VYY3 pKa = 8.76GTQNEE8 pKa = 4.13DD9 pKa = 3.54PEE11 pKa = 5.31RR12 pKa = 11.84GEE14 pKa = 3.96YY15 pKa = 9.95RR16 pKa = 11.84SLYY19 pKa = 10.15SDD21 pKa = 3.46QDD23 pKa = 3.61GDD25 pKa = 4.25DD26 pKa = 4.14TPSTTPLYY34 pKa = 8.29THH36 pKa = 7.68PSTAPNANNPEE47 pKa = 4.37FMSKK51 pKa = 10.15PNPRR55 pKa = 11.84RR56 pKa = 11.84RR57 pKa = 11.84SWIQFQQNLRR67 pKa = 11.84LPTSTEE73 pKa = 3.52VSTIAKK79 pKa = 9.87AVFGALGFIIGILVCTLAIITLIYY103 pKa = 10.53GCTEE107 pKa = 3.75VVNSIRR113 pKa = 11.84HH114 pKa = 5.18VDD116 pKa = 3.62DD117 pKa = 4.31PSPYY121 pKa = 9.93RR122 pKa = 11.84RR123 pKa = 11.84LSDD126 pKa = 3.49YY127 pKa = 10.41QGYY130 pKa = 8.47VAVEE134 pKa = 4.1DD135 pKa = 5.84DD136 pKa = 4.19IDD138 pKa = 4.2DD139 pKa = 4.9PYY141 pKa = 10.53PYY143 pKa = 9.62PYY145 pKa = 10.32SYY147 pKa = 10.91PLTDD151 pKa = 3.47GGGDD155 pKa = 3.21VDD157 pKa = 4.22TAPKK161 pKa = 11.09AMTTKK166 pKa = 10.49SGIEE170 pKa = 3.88VACFGEE176 pKa = 4.71AGTCEE181 pKa = 4.04ASLSEE186 pKa = 5.05LMRR189 pKa = 11.84IPQATRR195 pKa = 11.84VAVITDD201 pKa = 3.64GEE203 pKa = 4.25AWSDD207 pKa = 3.21ITGEE211 pKa = 4.32DD212 pKa = 3.63LDD214 pKa = 5.54GDD216 pKa = 3.89VDD218 pKa = 4.03IDD220 pKa = 4.0GDD222 pKa = 3.98GDD224 pKa = 3.73GDD226 pKa = 3.57EE227 pKa = 5.84GEE229 pKa = 4.89FPDD232 pKa = 5.72EE233 pKa = 4.02LACGNMWMEE242 pKa = 4.1EE243 pKa = 4.1DD244 pKa = 3.37EE245 pKa = 4.58GVVVDD250 pKa = 3.85EE251 pKa = 4.83LEE253 pKa = 4.28YY254 pKa = 11.39VSMLDD259 pKa = 3.73RR260 pKa = 11.84LWNGLFGGG268 pKa = 4.35
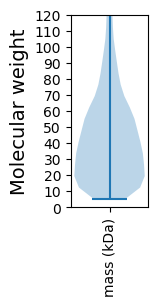
Molecular weight: 29.37 kDa
Isoelectric point according different methods:
Protein with the highest isoelectric point:
>tr|A0A1L9VJB7|A0A1L9VJB7_ASPGL Carrier domain-containing protein OS=Aspergillus glaucus CBS 516.65 OX=1160497 GN=ASPGLDRAFT_26190 PE=4 SV=1
MM1 pKa = 7.52FSRR4 pKa = 11.84RR5 pKa = 11.84TLPALRR11 pKa = 11.84TLRR14 pKa = 11.84AQTPLTTLNRR24 pKa = 11.84PFSSLLTSRR33 pKa = 11.84PSLPTTTITLTSTLSPLLSPLTSTLQSPIQSQLQSRR69 pKa = 11.84QFSASASLAGKK80 pKa = 10.15RR81 pKa = 11.84ITFNPSRR88 pKa = 11.84RR89 pKa = 11.84VQKK92 pKa = 10.2RR93 pKa = 11.84RR94 pKa = 11.84HH95 pKa = 5.33GFLARR100 pKa = 11.84LRR102 pKa = 11.84TRR104 pKa = 11.84GGRR107 pKa = 11.84KK108 pKa = 8.11ILMRR112 pKa = 11.84RR113 pKa = 11.84RR114 pKa = 11.84QRR116 pKa = 11.84GKK118 pKa = 10.57KK119 pKa = 9.12ALSWW123 pKa = 3.66
MM1 pKa = 7.52FSRR4 pKa = 11.84RR5 pKa = 11.84TLPALRR11 pKa = 11.84TLRR14 pKa = 11.84AQTPLTTLNRR24 pKa = 11.84PFSSLLTSRR33 pKa = 11.84PSLPTTTITLTSTLSPLLSPLTSTLQSPIQSQLQSRR69 pKa = 11.84QFSASASLAGKK80 pKa = 10.15RR81 pKa = 11.84ITFNPSRR88 pKa = 11.84RR89 pKa = 11.84VQKK92 pKa = 10.2RR93 pKa = 11.84RR94 pKa = 11.84HH95 pKa = 5.33GFLARR100 pKa = 11.84LRR102 pKa = 11.84TRR104 pKa = 11.84GGRR107 pKa = 11.84KK108 pKa = 8.11ILMRR112 pKa = 11.84RR113 pKa = 11.84RR114 pKa = 11.84QRR116 pKa = 11.84GKK118 pKa = 10.57KK119 pKa = 9.12ALSWW123 pKa = 3.66
Molecular weight: 13.93 kDa
Isoelectric point according different methods:
Peptides (in silico digests for buttom-up proteomics)
Below you can find in silico digests of the whole proteome with Trypsin, Chymotrypsin, Trypsin+LysC, LysN, ArgC proteases suitable for different mass spec machines.| Try ESI |
 |
|---|
| ChTry ESI |
 |
|---|
| ArgC ESI |
 |
|---|
| LysN ESI |
 |
|---|
| TryLysC ESI |
 |
|---|
| Try MALDI |
 |
|---|
| ChTry MALDI |
 |
|---|
| ArgC MALDI |
 |
|---|
| LysN MALDI |
 |
|---|
| TryLysC MALDI |
 |
|---|
| Try LTQ |
 |
|---|
| ChTry LTQ |
 |
|---|
| ArgC LTQ |
 |
|---|
| LysN LTQ |
 |
|---|
| TryLysC LTQ |
 |
|---|
| Try MSlow |
 |
|---|
| ChTry MSlow |
 |
|---|
| ArgC MSlow |
 |
|---|
| LysN MSlow |
 |
|---|
| TryLysC MSlow |
 |
|---|
| Try MShigh |
 |
|---|
| ChTry MShigh |
 |
|---|
| ArgC MShigh |
 |
|---|
| LysN MShigh |
 |
|---|
| TryLysC MShigh |
 |
|---|
General Statistics
Number of major isoforms |
Number of additional isoforms |
Number of all proteins |
Number of amino acids |
Min. Seq. Length |
Max. Seq. Length |
Avg. Seq. Length |
Avg. Mol. Weight |
|---|---|---|---|---|---|---|---|
4932616 |
49 |
6421 |
438.6 |
48.7 |
Amino acid frequency
Ala |
Cys |
Asp |
Glu |
Phe |
Gly |
His |
Ile |
Lys |
Leu |
|---|---|---|---|---|---|---|---|---|---|
8.093 ± 0.018 | 1.278 ± 0.011 |
5.718 ± 0.017 | 6.312 ± 0.025 |
3.791 ± 0.012 | 6.786 ± 0.021 |
2.452 ± 0.01 | 4.925 ± 0.015 |
4.728 ± 0.019 | 8.918 ± 0.026 |
Met |
Asn |
Gln |
Pro |
Arg |
Ser |
Thr |
Val |
Trp |
Tyr |
|---|---|---|---|---|---|---|---|---|---|
2.207 ± 0.008 | 3.844 ± 0.012 |
6.094 ± 0.028 | 4.171 ± 0.016 |
6.091 ± 0.019 | 8.287 ± 0.027 |
5.882 ± 0.015 | 6.126 ± 0.016 |
1.447 ± 0.008 | 2.85 ± 0.011 |
Most of the basic statistics you can see at this page can be downloaded from this CSV file
Proteome-pI is available under Creative Commons Attribution-NoDerivs license, for more details see here
| Reference: Kozlowski LP. Proteome-pI 2.0: Proteome Isoelectric Point Database Update. Nucleic Acids Res. 2021, doi: 10.1093/nar/gkab944 | Contact: Lukasz P. Kozlowski |
