Escherichia phage KBNP1711
Taxonomy: Viruses; Duplodnaviria; Heunggongvirae; Uroviricota; Caudoviricetes; Caudovirales; Podoviridae; Kuravirus; Escherichia virus Septima11
Average proteome isoelectric point is 6.41
Get precalculated fractions of proteins
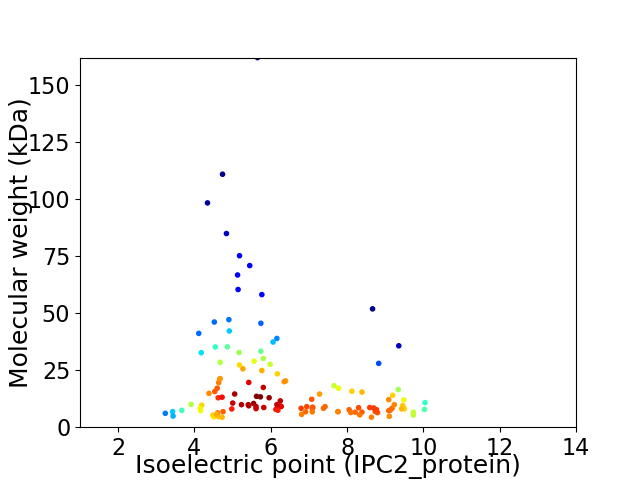
Virtual 2D-PAGE plot for 126 proteins (isoelectric point calculated using IPC2_protein)
Get csv file with sequences according to given criteria:
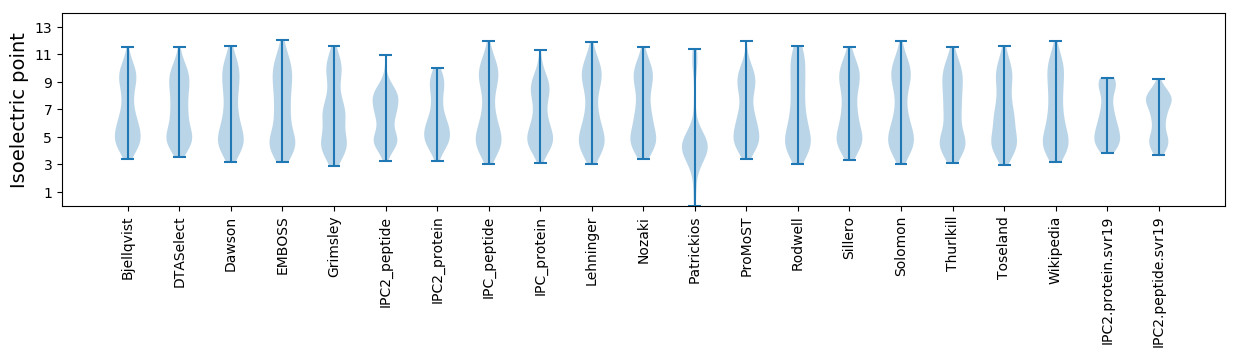
* You can choose from 21 different methods for calculating isoelectric point
Summary statistics related to proteome-wise predictions
Protein with the lowest isoelectric point:
>tr|W6AS96|W6AS96_9CAUD Uncharacterized protein OS=Escherichia phage KBNP1711 OX=1436889 GN=ECBP3_0064 PE=4 SV=1
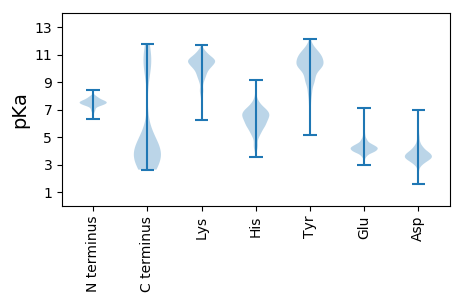
MM1 pKa = 7.58IFNASGNMPSLLWGIEE17 pKa = 4.19TNVLEE22 pKa = 4.43EE23 pKa = 4.0GQYY26 pKa = 10.57IDD28 pKa = 5.45FDD30 pKa = 4.09QLLEE34 pKa = 4.06LQKK37 pKa = 10.88VVNQLVSDD45 pKa = 3.84EE46 pKa = 4.12QSRR49 pKa = 11.84LLQEE53 pKa = 4.27SLSGDD58 pKa = 4.35FVCDD62 pKa = 3.0GCTII66 pKa = 3.95
MM1 pKa = 7.58IFNASGNMPSLLWGIEE17 pKa = 4.19TNVLEE22 pKa = 4.43EE23 pKa = 4.0GQYY26 pKa = 10.57IDD28 pKa = 5.45FDD30 pKa = 4.09QLLEE34 pKa = 4.06LQKK37 pKa = 10.88VVNQLVSDD45 pKa = 3.84EE46 pKa = 4.12QSRR49 pKa = 11.84LLQEE53 pKa = 4.27SLSGDD58 pKa = 4.35FVCDD62 pKa = 3.0GCTII66 pKa = 3.95
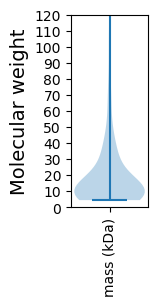
Molecular weight: 7.4 kDa
Isoelectric point according different methods:
Protein with the highest isoelectric point:
>tr|W6AS10|W6AS10_9CAUD Uncharacterized protein OS=Escherichia phage KBNP1711 OX=1436889 GN=ECBP3_0110 PE=4 SV=1
MM1 pKa = 7.59KK2 pKa = 10.17ARR4 pKa = 11.84RR5 pKa = 11.84TIWTPMQIEE14 pKa = 4.14NLRR17 pKa = 11.84RR18 pKa = 11.84LIKK21 pKa = 9.88EE22 pKa = 3.75YY23 pKa = 10.69SVQEE27 pKa = 3.87VAQIMNVTEE36 pKa = 4.05NAVNTACTKK45 pKa = 10.48FGISRR50 pKa = 11.84AVIRR54 pKa = 11.84VKK56 pKa = 9.81WSKK59 pKa = 11.29EE60 pKa = 3.16EE61 pKa = 3.89DD62 pKa = 3.11QFLIRR67 pKa = 11.84NAGFMSIQRR76 pKa = 11.84MADD79 pKa = 3.16MLGRR83 pKa = 11.84SYY85 pKa = 11.54AAVQNRR91 pKa = 11.84ACMHH95 pKa = 6.36LNISLKK101 pKa = 10.81LKK103 pKa = 10.59
MM1 pKa = 7.59KK2 pKa = 10.17ARR4 pKa = 11.84RR5 pKa = 11.84TIWTPMQIEE14 pKa = 4.14NLRR17 pKa = 11.84RR18 pKa = 11.84LIKK21 pKa = 9.88EE22 pKa = 3.75YY23 pKa = 10.69SVQEE27 pKa = 3.87VAQIMNVTEE36 pKa = 4.05NAVNTACTKK45 pKa = 10.48FGISRR50 pKa = 11.84AVIRR54 pKa = 11.84VKK56 pKa = 9.81WSKK59 pKa = 11.29EE60 pKa = 3.16EE61 pKa = 3.89DD62 pKa = 3.11QFLIRR67 pKa = 11.84NAGFMSIQRR76 pKa = 11.84MADD79 pKa = 3.16MLGRR83 pKa = 11.84SYY85 pKa = 11.54AAVQNRR91 pKa = 11.84ACMHH95 pKa = 6.36LNISLKK101 pKa = 10.81LKK103 pKa = 10.59
Molecular weight: 11.96 kDa
Isoelectric point according different methods:
Peptides (in silico digests for buttom-up proteomics)
Below you can find in silico digests of the whole proteome with Trypsin, Chymotrypsin, Trypsin+LysC, LysN, ArgC proteases suitable for different mass spec machines.| Try ESI |
 |
|---|
| ChTry ESI |
|
|---|
| ArgC ESI |
|
|---|
| LysN ESI |
|
|---|
| TryLysC ESI |
|
|---|
| Try MALDI |
|
|---|
| ChTry MALDI |
|
|---|
| ArgC MALDI |
|
|---|
| LysN MALDI |
|
|---|
| TryLysC MALDI |
|
|---|
| Try LTQ |
|
|---|
| ChTry LTQ |
|
|---|
| ArgC LTQ |
|
|---|
| LysN LTQ |
|
|---|
| TryLysC LTQ |
|
|---|
| Try MSlow |
|
|---|
| ChTry MSlow |
|
|---|
| ArgC MSlow |
|
|---|
| LysN MSlow |
|
|---|
| TryLysC MSlow |
|
|---|
| Try MShigh |
|
|---|
| ChTry MShigh |
|
|---|
| ArgC MShigh |
|
|---|
| LysN MShigh |
|
|---|
| TryLysC MShigh |
|
|---|
General Statistics
Number of major isoforms |
Number of additional isoforms |
Number of all proteins |
Number of amino acids |
Min. Seq. Length |
Max. Seq. Length |
Avg. Seq. Length |
Avg. Mol. Weight |
|---|---|---|---|---|---|---|---|
0 |
22573 |
38 |
1473 |
179.2 |
20.05 |
Amino acid frequency
Ala |
Cys |
Asp |
Glu |
Phe |
Gly |
His |
Ile |
Lys |
Leu |
|---|---|---|---|---|---|---|---|---|---|
7.921 ± 0.521 | 1.245 ± 0.158 |
6.282 ± 0.242 | 6.933 ± 0.316 |
3.956 ± 0.159 | 7.075 ± 0.346 |
1.723 ± 0.155 | 5.622 ± 0.231 |
6.211 ± 0.311 | 7.327 ± 0.187 |
Met |
Asn |
Gln |
Pro |
Arg |
Ser |
Thr |
Val |
Trp |
Tyr |
|---|---|---|---|---|---|---|---|---|---|
2.747 ± 0.149 | 5.6 ± 0.262 |
3.681 ± 0.157 | 4.049 ± 0.317 |
5.201 ± 0.216 | 6.769 ± 0.239 |
5.768 ± 0.276 | 6.964 ± 0.238 |
1.44 ± 0.104 | 3.486 ± 0.166 |
Most of the basic statistics you can see at this page can be downloaded from this CSV file
See this proteome in:

Proteome-pI is available under Creative Commons Attribution-NoDerivs license, for more details see here
| Reference: Kozlowski LP. Proteome-pI 2.0: Proteome Isoelectric Point Database Update. Nucleic Acids Res. 2021, doi: 10.1093/nar/gkab944 | Contact: Lukasz P. Kozlowski |