Nostocales cyanobacterium HT-58-2
Taxonomy: cellular organisms; Bacteria; Terrabacteria group; Cyanobacteria/Melainabacteria group; Cyanobacteria; Nostocales; unclassified Nostocales
Average proteome isoelectric point is 6.47
Get precalculated fractions of proteins

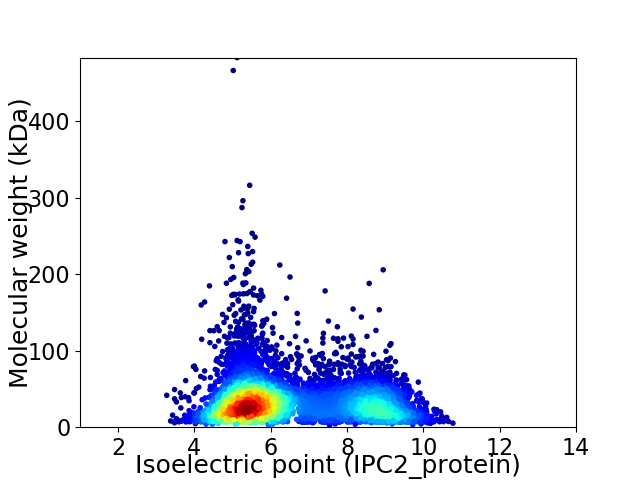
Virtual 2D-PAGE plot for 6085 proteins (isoelectric point calculated using IPC2_protein)
Get csv file with sequences according to given criteria:
* You can choose from 21 different methods for calculating isoelectric point
Summary statistics related to proteome-wise predictions


Protein with the lowest isoelectric point:
>tr|A0A1Y0RNJ5|A0A1Y0RNJ5_9CYAN Gamma-glutamyl phosphate reductase OS=Nostocales cyanobacterium HT-58-2 OX=1940762 GN=proA PE=3 SV=1
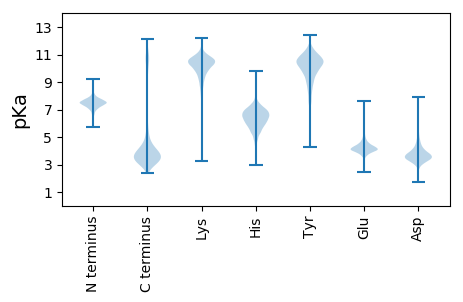
MM1 pKa = 7.59SNNSIQGNGNWYY13 pKa = 7.52YY14 pKa = 11.25TNGQWEE20 pKa = 4.41SDD22 pKa = 3.4EE23 pKa = 4.74GADD26 pKa = 5.3LSVADD31 pKa = 5.21AFASGNPPAGYY42 pKa = 9.9IPDD45 pKa = 4.7NISSATGNPLAGSSSSSSSGTDD67 pKa = 3.52FGGSIPFAGSGNSSSDD83 pKa = 3.26NPFAGGNPFMIGGGGNVSTTSADD106 pKa = 3.18GQYY109 pKa = 9.97TYY111 pKa = 11.26NYY113 pKa = 8.37TRR115 pKa = 11.84TADD118 pKa = 3.54ARR120 pKa = 11.84SLVPDD125 pKa = 4.75DD126 pKa = 4.45NSPFAKK132 pKa = 10.46LLGVLGVGSDD142 pKa = 3.49SSSNSGSNPFAGGSNPFSGGSTPTGDD168 pKa = 3.81TNPQLGGNNPYY179 pKa = 10.29FAGNGSGNSALGSSDD194 pKa = 3.68KK195 pKa = 11.04FPGNLPIANTAPSSTSDD212 pKa = 3.61SILPEE217 pKa = 4.18APEE220 pKa = 4.4GLSVPYY226 pKa = 10.53NSNNWISDD234 pKa = 3.63LKK236 pKa = 10.74DD237 pKa = 3.56LQSGEE242 pKa = 4.53PGASTSGNTGSGNGNWFYY260 pKa = 11.64ASNNTANGNGNWYY273 pKa = 10.33FSDD276 pKa = 4.29GNTTDD281 pKa = 5.06GNGNWFYY288 pKa = 11.66ASNNTANGNGNWYY301 pKa = 9.92FGSGNTTDD309 pKa = 5.59GNGNWSSGGNNTINGNGNRR328 pKa = 11.84PSGSGNTINGNGNKK342 pKa = 9.76PSGSGNNILGNANTSNTSGNNILGNHH368 pKa = 5.75VEE370 pKa = 4.11TSGDD374 pKa = 2.99GKK376 pKa = 11.03AYY378 pKa = 9.82IGNDD382 pKa = 2.9DD383 pKa = 3.52WSFDD387 pKa = 3.4ILNEE391 pKa = 4.07LKK393 pKa = 10.58SLQSGVSGVGSDD405 pKa = 3.79VNNFLSNPDD414 pKa = 4.36LISTTTSKK422 pKa = 10.98EE423 pKa = 3.98GFSNSPFLTNSNYY436 pKa = 9.77QFDD439 pKa = 4.37FSSGLL444 pKa = 3.5
MM1 pKa = 7.59SNNSIQGNGNWYY13 pKa = 7.52YY14 pKa = 11.25TNGQWEE20 pKa = 4.41SDD22 pKa = 3.4EE23 pKa = 4.74GADD26 pKa = 5.3LSVADD31 pKa = 5.21AFASGNPPAGYY42 pKa = 9.9IPDD45 pKa = 4.7NISSATGNPLAGSSSSSSSGTDD67 pKa = 3.52FGGSIPFAGSGNSSSDD83 pKa = 3.26NPFAGGNPFMIGGGGNVSTTSADD106 pKa = 3.18GQYY109 pKa = 9.97TYY111 pKa = 11.26NYY113 pKa = 8.37TRR115 pKa = 11.84TADD118 pKa = 3.54ARR120 pKa = 11.84SLVPDD125 pKa = 4.75DD126 pKa = 4.45NSPFAKK132 pKa = 10.46LLGVLGVGSDD142 pKa = 3.49SSSNSGSNPFAGGSNPFSGGSTPTGDD168 pKa = 3.81TNPQLGGNNPYY179 pKa = 10.29FAGNGSGNSALGSSDD194 pKa = 3.68KK195 pKa = 11.04FPGNLPIANTAPSSTSDD212 pKa = 3.61SILPEE217 pKa = 4.18APEE220 pKa = 4.4GLSVPYY226 pKa = 10.53NSNNWISDD234 pKa = 3.63LKK236 pKa = 10.74DD237 pKa = 3.56LQSGEE242 pKa = 4.53PGASTSGNTGSGNGNWFYY260 pKa = 11.64ASNNTANGNGNWYY273 pKa = 10.33FSDD276 pKa = 4.29GNTTDD281 pKa = 5.06GNGNWFYY288 pKa = 11.66ASNNTANGNGNWYY301 pKa = 9.92FGSGNTTDD309 pKa = 5.59GNGNWSSGGNNTINGNGNRR328 pKa = 11.84PSGSGNTINGNGNKK342 pKa = 9.76PSGSGNNILGNANTSNTSGNNILGNHH368 pKa = 5.75VEE370 pKa = 4.11TSGDD374 pKa = 2.99GKK376 pKa = 11.03AYY378 pKa = 9.82IGNDD382 pKa = 2.9DD383 pKa = 3.52WSFDD387 pKa = 3.4ILNEE391 pKa = 4.07LKK393 pKa = 10.58SLQSGVSGVGSDD405 pKa = 3.79VNNFLSNPDD414 pKa = 4.36LISTTTSKK422 pKa = 10.98EE423 pKa = 3.98GFSNSPFLTNSNYY436 pKa = 9.77QFDD439 pKa = 4.37FSSGLL444 pKa = 3.5
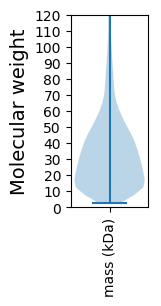
Molecular weight: 44.83 kDa
Isoelectric point according different methods:
Protein with the highest isoelectric point:
>tr|A0A1Y0RN93|A0A1Y0RN93_9CYAN Uncharacterized protein OS=Nostocales cyanobacterium HT-58-2 OX=1940762 GN=BZZ01_16335 PE=4 SV=1
MM1 pKa = 7.42KK2 pKa = 10.43LNYY5 pKa = 9.15RR6 pKa = 11.84RR7 pKa = 11.84CISCRR12 pKa = 11.84KK13 pKa = 9.63VGLKK17 pKa = 9.99QEE19 pKa = 4.31FWRR22 pKa = 11.84IVRR25 pKa = 11.84VFPSGQVQLDD35 pKa = 3.42EE36 pKa = 4.54GMGRR40 pKa = 11.84SAYY43 pKa = 9.38ICPQQSCLAAAQKK56 pKa = 10.6KK57 pKa = 9.1NRR59 pKa = 11.84LGRR62 pKa = 11.84SLRR65 pKa = 11.84ASVPEE70 pKa = 3.86ALYY73 pKa = 10.57HH74 pKa = 6.78ILQQRR79 pKa = 11.84LSQSHH84 pKa = 5.26NQKK87 pKa = 8.18QTT89 pKa = 2.89
MM1 pKa = 7.42KK2 pKa = 10.43LNYY5 pKa = 9.15RR6 pKa = 11.84RR7 pKa = 11.84CISCRR12 pKa = 11.84KK13 pKa = 9.63VGLKK17 pKa = 9.99QEE19 pKa = 4.31FWRR22 pKa = 11.84IVRR25 pKa = 11.84VFPSGQVQLDD35 pKa = 3.42EE36 pKa = 4.54GMGRR40 pKa = 11.84SAYY43 pKa = 9.38ICPQQSCLAAAQKK56 pKa = 10.6KK57 pKa = 9.1NRR59 pKa = 11.84LGRR62 pKa = 11.84SLRR65 pKa = 11.84ASVPEE70 pKa = 3.86ALYY73 pKa = 10.57HH74 pKa = 6.78ILQQRR79 pKa = 11.84LSQSHH84 pKa = 5.26NQKK87 pKa = 8.18QTT89 pKa = 2.89
Molecular weight: 10.29 kDa
Isoelectric point according different methods:
Peptides (in silico digests for buttom-up proteomics)
Below you can find in silico digests of the whole proteome with Trypsin, Chymotrypsin, Trypsin+LysC, LysN, ArgC proteases suitable for different mass spec machines.| Try ESI |
 |
|---|
| ChTry ESI |
 |
|---|
| ArgC ESI |
 |
|---|
| LysN ESI |
 |
|---|
| TryLysC ESI |
 |
|---|
| Try MALDI |
 |
|---|
| ChTry MALDI |
 |
|---|
| ArgC MALDI |
 |
|---|
| LysN MALDI |
 |
|---|
| TryLysC MALDI |
 |
|---|
| Try LTQ |
 |
|---|
| ChTry LTQ |
 |
|---|
| ArgC LTQ |
 |
|---|
| LysN LTQ |
 |
|---|
| TryLysC LTQ |
 |
|---|
| Try MSlow |
 |
|---|
| ChTry MSlow |
 |
|---|
| ArgC MSlow |
 |
|---|
| LysN MSlow |
 |
|---|
| TryLysC MSlow |
 |
|---|
| Try MShigh |
 |
|---|
| ChTry MShigh |
 |
|---|
| ArgC MShigh |
 |
|---|
| LysN MShigh |
 |
|---|
| TryLysC MShigh |
 |
|---|
General Statistics
Number of major isoforms |
Number of additional isoforms |
Number of all proteins |
Number of amino acids |
Min. Seq. Length |
Max. Seq. Length |
Avg. Seq. Length |
Avg. Mol. Weight |
|---|---|---|---|---|---|---|---|
0 |
2015771 |
24 |
4291 |
331.3 |
36.92 |
Amino acid frequency
Ala |
Cys |
Asp |
Glu |
Phe |
Gly |
His |
Ile |
Lys |
Leu |
|---|---|---|---|---|---|---|---|---|---|
8.129 ± 0.034 | 1.023 ± 0.011 |
4.677 ± 0.024 | 6.275 ± 0.035 |
3.978 ± 0.022 | 6.68 ± 0.037 |
1.961 ± 0.015 | 6.439 ± 0.025 |
4.849 ± 0.03 | 10.976 ± 0.041 |
Met |
Asn |
Gln |
Pro |
Arg |
Ser |
Thr |
Val |
Trp |
Tyr |
|---|---|---|---|---|---|---|---|---|---|
1.834 ± 0.013 | 4.179 ± 0.022 |
4.744 ± 0.025 | 5.489 ± 0.033 |
5.213 ± 0.025 | 6.462 ± 0.027 |
5.724 ± 0.023 | 6.938 ± 0.026 |
1.422 ± 0.012 | 3.005 ± 0.019 |
Most of the basic statistics you can see at this page can be downloaded from this CSV file
Proteome-pI is available under Creative Commons Attribution-NoDerivs license, for more details see here
| Reference: Kozlowski LP. Proteome-pI 2.0: Proteome Isoelectric Point Database Update. Nucleic Acids Res. 2021, doi: 10.1093/nar/gkab944 | Contact: Lukasz P. Kozlowski |
