Jatropha yellow mosaic virus
Taxonomy: Viruses; Monodnaviria; Shotokuvirae; Cressdnaviricota; Repensiviricetes; Geplafuvirales; Geminiviridae; Begomovirus
Average proteome isoelectric point is 7.37
Get precalculated fractions of proteins

Virtual 2D-PAGE plot for 6 proteins (isoelectric point calculated using IPC2_protein)
Get csv file with sequences according to given criteria:
* You can choose from 21 different methods for calculating isoelectric point
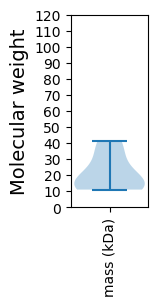
Summary statistics related to proteome-wise predictions


Protein with the lowest isoelectric point:
>tr|B6DXE5|B6DXE5_9GEMI Capsid protein OS=Jatropha yellow mosaic virus OX=1485012 PE=3 SV=1
MM1 pKa = 8.06WDD3 pKa = 3.35PLLNEE8 pKa = 4.38FPEE11 pKa = 4.68TVHH14 pKa = 7.0GFRR17 pKa = 11.84CMLAVKK23 pKa = 9.87YY24 pKa = 10.06LQLVEE29 pKa = 4.35KK30 pKa = 9.32TYY32 pKa = 11.38SPDD35 pKa = 3.08TLGYY39 pKa = 10.84DD40 pKa = 4.83LIRR43 pKa = 11.84DD44 pKa = 4.71LISVIRR50 pKa = 11.84ARR52 pKa = 11.84NYY54 pKa = 9.49VEE56 pKa = 3.52ATSRR60 pKa = 11.84YY61 pKa = 6.98NHH63 pKa = 5.62FHH65 pKa = 6.55ARR67 pKa = 11.84LEE69 pKa = 4.22GTPPSQLRR77 pKa = 11.84QLICEE82 pKa = 4.49PCCCPHH88 pKa = 7.46CPRR91 pKa = 11.84QQSKK95 pKa = 11.24SMGEE99 pKa = 3.79QADD102 pKa = 3.84EE103 pKa = 4.18QKK105 pKa = 11.12AQDD108 pKa = 3.57VQAVQKK114 pKa = 10.44SGCSS118 pKa = 3.21
MM1 pKa = 8.06WDD3 pKa = 3.35PLLNEE8 pKa = 4.38FPEE11 pKa = 4.68TVHH14 pKa = 7.0GFRR17 pKa = 11.84CMLAVKK23 pKa = 9.87YY24 pKa = 10.06LQLVEE29 pKa = 4.35KK30 pKa = 9.32TYY32 pKa = 11.38SPDD35 pKa = 3.08TLGYY39 pKa = 10.84DD40 pKa = 4.83LIRR43 pKa = 11.84DD44 pKa = 4.71LISVIRR50 pKa = 11.84ARR52 pKa = 11.84NYY54 pKa = 9.49VEE56 pKa = 3.52ATSRR60 pKa = 11.84YY61 pKa = 6.98NHH63 pKa = 5.62FHH65 pKa = 6.55ARR67 pKa = 11.84LEE69 pKa = 4.22GTPPSQLRR77 pKa = 11.84QLICEE82 pKa = 4.49PCCCPHH88 pKa = 7.46CPRR91 pKa = 11.84QQSKK95 pKa = 11.24SMGEE99 pKa = 3.79QADD102 pKa = 3.84EE103 pKa = 4.18QKK105 pKa = 11.12AQDD108 pKa = 3.57VQAVQKK114 pKa = 10.44SGCSS118 pKa = 3.21
Molecular weight: 13.52 kDa
Isoelectric point according different methods:
Protein with the highest isoelectric point:
>tr|B6DXE7|B6DXE7_9GEMI Transcriptional activator protein OS=Jatropha yellow mosaic virus OX=1485012 PE=3 SV=2
MM1 pKa = 8.22DD2 pKa = 4.53SRR4 pKa = 11.84TGEE7 pKa = 4.61PITAARR13 pKa = 11.84FNNGVFIWTVPNPLYY28 pKa = 10.74FRR30 pKa = 11.84VPVHH34 pKa = 5.82MSRR37 pKa = 11.84PFHH40 pKa = 6.65LEE42 pKa = 2.93QDD44 pKa = 3.75IIHH47 pKa = 6.26IQIQFNHH54 pKa = 6.39NLRR57 pKa = 11.84QALQIHH63 pKa = 6.24KK64 pKa = 9.72CFLSFKK70 pKa = 8.64VWTRR74 pKa = 11.84SRR76 pKa = 11.84IPTGSFLRR84 pKa = 11.84VFKK87 pKa = 9.78TQVIRR92 pKa = 11.84YY93 pKa = 8.39LDD95 pKa = 3.66RR96 pKa = 11.84LGVISINLVIRR107 pKa = 11.84AVDD110 pKa = 3.34HH111 pKa = 5.62VLYY114 pKa = 10.9NVLHH118 pKa = 6.82HH119 pKa = 7.1DD120 pKa = 4.08ANVEE124 pKa = 3.85QSNEE128 pKa = 3.91IIFRR132 pKa = 11.84LYY134 pKa = 10.85
MM1 pKa = 8.22DD2 pKa = 4.53SRR4 pKa = 11.84TGEE7 pKa = 4.61PITAARR13 pKa = 11.84FNNGVFIWTVPNPLYY28 pKa = 10.74FRR30 pKa = 11.84VPVHH34 pKa = 5.82MSRR37 pKa = 11.84PFHH40 pKa = 6.65LEE42 pKa = 2.93QDD44 pKa = 3.75IIHH47 pKa = 6.26IQIQFNHH54 pKa = 6.39NLRR57 pKa = 11.84QALQIHH63 pKa = 6.24KK64 pKa = 9.72CFLSFKK70 pKa = 8.64VWTRR74 pKa = 11.84SRR76 pKa = 11.84IPTGSFLRR84 pKa = 11.84VFKK87 pKa = 9.78TQVIRR92 pKa = 11.84YY93 pKa = 8.39LDD95 pKa = 3.66RR96 pKa = 11.84LGVISINLVIRR107 pKa = 11.84AVDD110 pKa = 3.34HH111 pKa = 5.62VLYY114 pKa = 10.9NVLHH118 pKa = 6.82HH119 pKa = 7.1DD120 pKa = 4.08ANVEE124 pKa = 3.85QSNEE128 pKa = 3.91IIFRR132 pKa = 11.84LYY134 pKa = 10.85
Molecular weight: 15.87 kDa
Isoelectric point according different methods:
Peptides (in silico digests for buttom-up proteomics)
Below you can find in silico digests of the whole proteome with Trypsin, Chymotrypsin, Trypsin+LysC, LysN, ArgC proteases suitable for different mass spec machines.| Try ESI |
 |
|---|
| ChTry ESI |
 |
|---|
| ArgC ESI |
 |
|---|
| LysN ESI |
 |
|---|
| TryLysC ESI |
 |
|---|
| Try MALDI |
 |
|---|
| ChTry MALDI |
 |
|---|
| ArgC MALDI |
 |
|---|
| LysN MALDI |
 |
|---|
| TryLysC MALDI |
 |
|---|
| Try LTQ |
 |
|---|
| ChTry LTQ |
 |
|---|
| ArgC LTQ |
 |
|---|
| LysN LTQ |
 |
|---|
| TryLysC LTQ |
 |
|---|
| Try MSlow |
 |
|---|
| ChTry MSlow |
 |
|---|
| ArgC MSlow |
 |
|---|
| LysN MSlow |
 |
|---|
| TryLysC MSlow |
 |
|---|
| Try MShigh |
 |
|---|
| ChTry MShigh |
 |
|---|
| ArgC MShigh |
 |
|---|
| LysN MShigh |
 |
|---|
| TryLysC MShigh |
 |
|---|
General Statistics
Number of major isoforms |
Number of additional isoforms |
Number of all proteins |
Number of amino acids |
Min. Seq. Length |
Max. Seq. Length |
Avg. Seq. Length |
Avg. Mol. Weight |
|---|---|---|---|---|---|---|---|
0 |
1100 |
97 |
361 |
183.3 |
21.0 |
Amino acid frequency
Ala |
Cys |
Asp |
Glu |
Phe |
Gly |
His |
Ile |
Lys |
Leu |
|---|---|---|---|---|---|---|---|---|---|
5.545 ± 0.611 | 2.091 ± 0.641 |
4.727 ± 0.321 | 4.909 ± 0.743 |
4.545 ± 0.627 | 4.636 ± 0.369 |
3.818 ± 0.595 | 5.0 ± 0.774 |
5.545 ± 0.877 | 7.364 ± 0.793 |
Met |
Asn |
Gln |
Pro |
Arg |
Ser |
Thr |
Val |
Trp |
Tyr |
|---|---|---|---|---|---|---|---|---|---|
2.273 ± 0.515 | 5.455 ± 0.676 |
6.0 ± 0.497 | 5.455 ± 0.812 |
6.636 ± 0.894 | 8.909 ± 1.087 |
5.455 ± 0.796 | 6.364 ± 1.288 |
1.455 ± 0.127 | 3.818 ± 0.386 |
Most of the basic statistics you can see at this page can be downloaded from this CSV file
Proteome-pI is available under Creative Commons Attribution-NoDerivs license, for more details see here
| Reference: Kozlowski LP. Proteome-pI 2.0: Proteome Isoelectric Point Database Update. Nucleic Acids Res. 2021, doi: 10.1093/nar/gkab944 | Contact: Lukasz P. Kozlowski |
