Ignisphaera aggregans (strain DSM 17230 / JCM 13409 / AQ1.S1)
Taxonomy: cellular organisms; Archaea; TACK group; Crenarchaeota; Thermoprotei; Desulfurococcales; Desulfurococcaceae; Ignisphaera; Ignisphaera aggregans
Average proteome isoelectric point is 6.88
Get precalculated fractions of proteins

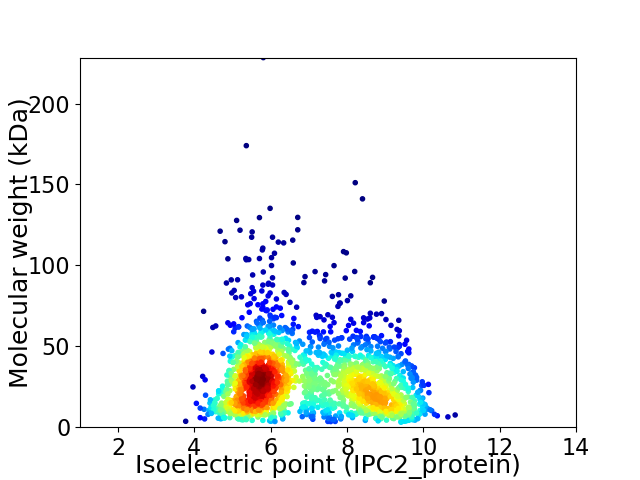
Virtual 2D-PAGE plot for 1929 proteins (isoelectric point calculated using IPC2_protein)
Get csv file with sequences according to given criteria:
* You can choose from 21 different methods for calculating isoelectric point
Summary statistics related to proteome-wise predictions


Protein with the lowest isoelectric point:
>tr|E0SS57|E0SS57_IGNAA Tryptophan synthase OS=Ignisphaera aggregans (strain DSM 17230 / JCM 13409 / AQ1.S1) OX=583356 GN=Igag_1717 PE=3 SV=1
MM1 pKa = 7.26NRR3 pKa = 11.84RR4 pKa = 11.84LISFSLILLTLLTVATLAMWSEE26 pKa = 4.17TLRR29 pKa = 11.84VNVAVGTGEE38 pKa = 3.99VDD40 pKa = 3.1WEE42 pKa = 4.43IVSGPTTWLDD52 pKa = 3.31ACGLQPGYY60 pKa = 11.17GYY62 pKa = 10.83FRR64 pKa = 11.84GNDD67 pKa = 3.08WNASYY72 pKa = 10.71LPEE75 pKa = 5.18PGADD79 pKa = 3.44QLDD82 pKa = 4.07KK83 pKa = 11.45DD84 pKa = 4.36VGCTDD89 pKa = 3.02VTLIDD94 pKa = 3.7SDD96 pKa = 4.2GDD98 pKa = 3.47GDD100 pKa = 4.6YY101 pKa = 10.7DD102 pKa = 3.82TMRR105 pKa = 11.84VTLYY109 pKa = 10.77NVYY112 pKa = 9.24PWYY115 pKa = 8.59YY116 pKa = 7.8THH118 pKa = 7.88IAFKK122 pKa = 10.28VHH124 pKa = 6.79NDD126 pKa = 2.86GTIPIKK132 pKa = 9.59IWRR135 pKa = 11.84IIIDD139 pKa = 3.36NQEE142 pKa = 4.02FYY144 pKa = 11.17EE145 pKa = 5.34LNAQPLKK152 pKa = 10.77EE153 pKa = 4.08GLYY156 pKa = 10.7LDD158 pKa = 3.86LTGDD162 pKa = 3.76GKK164 pKa = 11.41SDD166 pKa = 3.46VLIWWGDD173 pKa = 3.38NFGVQLHH180 pKa = 6.9PCQSADD186 pKa = 2.93ISLDD190 pKa = 3.11ITVLQDD196 pKa = 3.27APQGSTLSFTVSFEE210 pKa = 4.32AIQWNEE216 pKa = 3.82YY217 pKa = 9.36YY218 pKa = 10.86VPSS221 pKa = 4.03
MM1 pKa = 7.26NRR3 pKa = 11.84RR4 pKa = 11.84LISFSLILLTLLTVATLAMWSEE26 pKa = 4.17TLRR29 pKa = 11.84VNVAVGTGEE38 pKa = 3.99VDD40 pKa = 3.1WEE42 pKa = 4.43IVSGPTTWLDD52 pKa = 3.31ACGLQPGYY60 pKa = 11.17GYY62 pKa = 10.83FRR64 pKa = 11.84GNDD67 pKa = 3.08WNASYY72 pKa = 10.71LPEE75 pKa = 5.18PGADD79 pKa = 3.44QLDD82 pKa = 4.07KK83 pKa = 11.45DD84 pKa = 4.36VGCTDD89 pKa = 3.02VTLIDD94 pKa = 3.7SDD96 pKa = 4.2GDD98 pKa = 3.47GDD100 pKa = 4.6YY101 pKa = 10.7DD102 pKa = 3.82TMRR105 pKa = 11.84VTLYY109 pKa = 10.77NVYY112 pKa = 9.24PWYY115 pKa = 8.59YY116 pKa = 7.8THH118 pKa = 7.88IAFKK122 pKa = 10.28VHH124 pKa = 6.79NDD126 pKa = 2.86GTIPIKK132 pKa = 9.59IWRR135 pKa = 11.84IIIDD139 pKa = 3.36NQEE142 pKa = 4.02FYY144 pKa = 11.17EE145 pKa = 5.34LNAQPLKK152 pKa = 10.77EE153 pKa = 4.08GLYY156 pKa = 10.7LDD158 pKa = 3.86LTGDD162 pKa = 3.76GKK164 pKa = 11.41SDD166 pKa = 3.46VLIWWGDD173 pKa = 3.38NFGVQLHH180 pKa = 6.9PCQSADD186 pKa = 2.93ISLDD190 pKa = 3.11ITVLQDD196 pKa = 3.27APQGSTLSFTVSFEE210 pKa = 4.32AIQWNEE216 pKa = 3.82YY217 pKa = 9.36YY218 pKa = 10.86VPSS221 pKa = 4.03
Molecular weight: 24.88 kDa
Isoelectric point according different methods:
Protein with the highest isoelectric point:
>sp|E0SQX5|RRP4_IGNAA Exosome complex component Rrp4 OS=Ignisphaera aggregans (strain DSM 17230 / JCM 13409 / AQ1.S1) OX=583356 GN=rrp4 PE=3 SV=1
MM1 pKa = 7.72VSLLRR6 pKa = 11.84CNDD9 pKa = 2.81NVIRR13 pKa = 11.84VGKK16 pKa = 9.13KK17 pKa = 8.41FYY19 pKa = 9.64MRR21 pKa = 11.84YY22 pKa = 8.73VAAILYY28 pKa = 8.96KK29 pKa = 10.58RR30 pKa = 11.84NIEE33 pKa = 4.03KK34 pKa = 10.55CSTIMLRR41 pKa = 11.84ALGRR45 pKa = 11.84NISRR49 pKa = 11.84AISIATAAMFLDD61 pKa = 3.57SSLYY65 pKa = 9.68PSEE68 pKa = 4.68ARR70 pKa = 11.84IFSIFLSSGGRR81 pKa = 11.84EE82 pKa = 3.9LRR84 pKa = 11.84KK85 pKa = 10.27SGIEE89 pKa = 3.54LVLRR93 pKa = 11.84VRR95 pKa = 11.84DD96 pKa = 5.11FIPP99 pKa = 3.84
MM1 pKa = 7.72VSLLRR6 pKa = 11.84CNDD9 pKa = 2.81NVIRR13 pKa = 11.84VGKK16 pKa = 9.13KK17 pKa = 8.41FYY19 pKa = 9.64MRR21 pKa = 11.84YY22 pKa = 8.73VAAILYY28 pKa = 8.96KK29 pKa = 10.58RR30 pKa = 11.84NIEE33 pKa = 4.03KK34 pKa = 10.55CSTIMLRR41 pKa = 11.84ALGRR45 pKa = 11.84NISRR49 pKa = 11.84AISIATAAMFLDD61 pKa = 3.57SSLYY65 pKa = 9.68PSEE68 pKa = 4.68ARR70 pKa = 11.84IFSIFLSSGGRR81 pKa = 11.84EE82 pKa = 3.9LRR84 pKa = 11.84KK85 pKa = 10.27SGIEE89 pKa = 3.54LVLRR93 pKa = 11.84VRR95 pKa = 11.84DD96 pKa = 5.11FIPP99 pKa = 3.84
Molecular weight: 11.26 kDa
Isoelectric point according different methods:
Peptides (in silico digests for buttom-up proteomics)
Below you can find in silico digests of the whole proteome with Trypsin, Chymotrypsin, Trypsin+LysC, LysN, ArgC proteases suitable for different mass spec machines.| Try ESI |
 |
|---|
| ChTry ESI |
 |
|---|
| ArgC ESI |
 |
|---|
| LysN ESI |
 |
|---|
| TryLysC ESI |
 |
|---|
| Try MALDI |
 |
|---|
| ChTry MALDI |
 |
|---|
| ArgC MALDI |
 |
|---|
| LysN MALDI |
 |
|---|
| TryLysC MALDI |
 |
|---|
| Try LTQ |
 |
|---|
| ChTry LTQ |
 |
|---|
| ArgC LTQ |
 |
|---|
| LysN LTQ |
 |
|---|
| TryLysC LTQ |
 |
|---|
| Try MSlow |
 |
|---|
| ChTry MSlow |
 |
|---|
| ArgC MSlow |
 |
|---|
| LysN MSlow |
 |
|---|
| TryLysC MSlow |
 |
|---|
| Try MShigh |
 |
|---|
| ChTry MShigh |
 |
|---|
| ArgC MShigh |
 |
|---|
| LysN MShigh |
 |
|---|
| TryLysC MShigh |
 |
|---|
General Statistics
Number of major isoforms |
Number of additional isoforms |
Number of all proteins |
Number of amino acids |
Min. Seq. Length |
Max. Seq. Length |
Avg. Seq. Length |
Avg. Mol. Weight |
|---|---|---|---|---|---|---|---|
0 |
537386 |
30 |
1967 |
278.6 |
31.59 |
Amino acid frequency
Ala |
Cys |
Asp |
Glu |
Phe |
Gly |
His |
Ile |
Lys |
Leu |
|---|---|---|---|---|---|---|---|---|---|
6.054 ± 0.052 | 0.913 ± 0.018 |
5.195 ± 0.039 | 6.773 ± 0.069 |
3.609 ± 0.036 | 6.198 ± 0.052 |
1.469 ± 0.024 | 11.464 ± 0.07 |
5.914 ± 0.056 | 9.753 ± 0.063 |
Met |
Asn |
Gln |
Pro |
Arg |
Ser |
Thr |
Val |
Trp |
Tyr |
|---|---|---|---|---|---|---|---|---|---|
2.366 ± 0.023 | 3.955 ± 0.038 |
3.968 ± 0.04 | 1.733 ± 0.027 |
6.302 ± 0.05 | 6.613 ± 0.049 |
4.542 ± 0.056 | 7.367 ± 0.052 |
1.05 ± 0.023 | 4.762 ± 0.043 |
Most of the basic statistics you can see at this page can be downloaded from this CSV file
Proteome-pI is available under Creative Commons Attribution-NoDerivs license, for more details see here
| Reference: Kozlowski LP. Proteome-pI 2.0: Proteome Isoelectric Point Database Update. Nucleic Acids Res. 2021, doi: 10.1093/nar/gkab944 | Contact: Lukasz P. Kozlowski |
