SAR86 cluster bacterium SAR86A
Taxonomy: cellular organisms; Bacteria; Proteobacteria; Gammaproteobacteria; Gammaproteobacteria incertae sedis; SAR86 cluster
Average proteome isoelectric point is 6.09
Get precalculated fractions of proteins

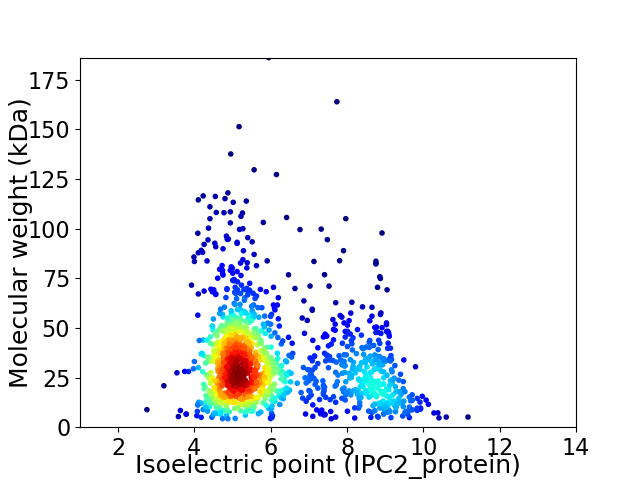
Virtual 2D-PAGE plot for 1298 proteins (isoelectric point calculated using IPC2_protein)
Get csv file with sequences according to given criteria:
* You can choose from 21 different methods for calculating isoelectric point
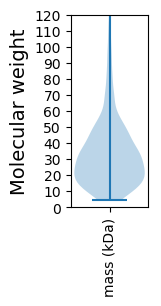
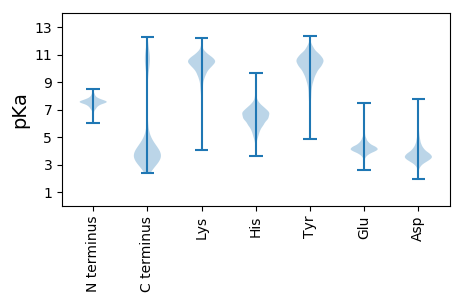
Summary statistics related to proteome-wise predictions


Protein with the lowest isoelectric point:
>tr|J5K8A8|J5K8A8_9GAMM Lipoprotein ABC transporter ATP-binding protein OS=SAR86 cluster bacterium SAR86A OX=1123866 GN=lolD PE=4 SV=1
MM1 pKa = 7.74KK2 pKa = 10.56KK3 pKa = 8.76FTLLLTSIFLISACSQSDD21 pKa = 3.53NQNQAEE27 pKa = 4.37TSDD30 pKa = 4.03APPSLVEE37 pKa = 4.14YY38 pKa = 9.11VWHH41 pKa = 6.7KK42 pKa = 10.93AGSEE46 pKa = 3.96FSAEE50 pKa = 3.8NLAMLIRR57 pKa = 11.84SWNGMIDD64 pKa = 3.98DD65 pKa = 4.64AMCNGMMGANILTPEE80 pKa = 4.23VANEE84 pKa = 4.37GYY86 pKa = 11.01DD87 pKa = 4.14FIWVLLWDD95 pKa = 4.12SQSSRR100 pKa = 11.84DD101 pKa = 3.91ACWDD105 pKa = 3.23DD106 pKa = 2.88WTTNLQSNWDD116 pKa = 3.79TMIDD120 pKa = 4.23GIMQYY125 pKa = 11.3DD126 pKa = 4.51LDD128 pKa = 3.96NVYY131 pKa = 11.01LFGWTIGQYY140 pKa = 10.52PKK142 pKa = 10.78VEE144 pKa = 4.12NDD146 pKa = 2.76TGSFVNSFNFCNYY159 pKa = 10.07NEE161 pKa = 5.08GYY163 pKa = 10.16SEE165 pKa = 4.94ADD167 pKa = 3.06LDD169 pKa = 4.1TFRR172 pKa = 11.84DD173 pKa = 4.56DD174 pKa = 3.64IAATNWSDD182 pKa = 3.67SYY184 pKa = 11.12WYY186 pKa = 10.86GLLDD190 pKa = 4.3PKK192 pKa = 10.91FEE194 pKa = 4.64PADD197 pKa = 3.78PAPDD201 pKa = 4.25FVWLDD206 pKa = 3.03LWANSAEE213 pKa = 4.92KK214 pKa = 10.44EE215 pKa = 4.09IAQNKK220 pKa = 8.53YY221 pKa = 10.61NNSDD225 pKa = 3.63LPSTTGAAFTCNNVDD240 pKa = 4.01FSGVAIRR247 pKa = 11.84RR248 pKa = 3.79
MM1 pKa = 7.74KK2 pKa = 10.56KK3 pKa = 8.76FTLLLTSIFLISACSQSDD21 pKa = 3.53NQNQAEE27 pKa = 4.37TSDD30 pKa = 4.03APPSLVEE37 pKa = 4.14YY38 pKa = 9.11VWHH41 pKa = 6.7KK42 pKa = 10.93AGSEE46 pKa = 3.96FSAEE50 pKa = 3.8NLAMLIRR57 pKa = 11.84SWNGMIDD64 pKa = 3.98DD65 pKa = 4.64AMCNGMMGANILTPEE80 pKa = 4.23VANEE84 pKa = 4.37GYY86 pKa = 11.01DD87 pKa = 4.14FIWVLLWDD95 pKa = 4.12SQSSRR100 pKa = 11.84DD101 pKa = 3.91ACWDD105 pKa = 3.23DD106 pKa = 2.88WTTNLQSNWDD116 pKa = 3.79TMIDD120 pKa = 4.23GIMQYY125 pKa = 11.3DD126 pKa = 4.51LDD128 pKa = 3.96NVYY131 pKa = 11.01LFGWTIGQYY140 pKa = 10.52PKK142 pKa = 10.78VEE144 pKa = 4.12NDD146 pKa = 2.76TGSFVNSFNFCNYY159 pKa = 10.07NEE161 pKa = 5.08GYY163 pKa = 10.16SEE165 pKa = 4.94ADD167 pKa = 3.06LDD169 pKa = 4.1TFRR172 pKa = 11.84DD173 pKa = 4.56DD174 pKa = 3.64IAATNWSDD182 pKa = 3.67SYY184 pKa = 11.12WYY186 pKa = 10.86GLLDD190 pKa = 4.3PKK192 pKa = 10.91FEE194 pKa = 4.64PADD197 pKa = 3.78PAPDD201 pKa = 4.25FVWLDD206 pKa = 3.03LWANSAEE213 pKa = 4.92KK214 pKa = 10.44EE215 pKa = 4.09IAQNKK220 pKa = 8.53YY221 pKa = 10.61NNSDD225 pKa = 3.63LPSTTGAAFTCNNVDD240 pKa = 4.01FSGVAIRR247 pKa = 11.84RR248 pKa = 3.79
Molecular weight: 28.08 kDa
Isoelectric point according different methods:
Protein with the highest isoelectric point:
>tr|J4KRQ4|J4KRQ4_9GAMM Methionyl-tRNA formyltransferase OS=SAR86 cluster bacterium SAR86A OX=1123866 GN=fmt PE=3 SV=1
MM1 pKa = 7.45KK2 pKa = 9.61RR3 pKa = 11.84TFQPSNLKK11 pKa = 10.2RR12 pKa = 11.84KK13 pKa = 7.57RR14 pKa = 11.84THH16 pKa = 5.88GFRR19 pKa = 11.84ARR21 pKa = 11.84MSTKK25 pKa = 9.99AGRR28 pKa = 11.84AVLSNRR34 pKa = 11.84RR35 pKa = 11.84KK36 pKa = 9.99KK37 pKa = 9.78GRR39 pKa = 11.84KK40 pKa = 8.66VLSAA44 pKa = 4.05
MM1 pKa = 7.45KK2 pKa = 9.61RR3 pKa = 11.84TFQPSNLKK11 pKa = 10.2RR12 pKa = 11.84KK13 pKa = 7.57RR14 pKa = 11.84THH16 pKa = 5.88GFRR19 pKa = 11.84ARR21 pKa = 11.84MSTKK25 pKa = 9.99AGRR28 pKa = 11.84AVLSNRR34 pKa = 11.84RR35 pKa = 11.84KK36 pKa = 9.99KK37 pKa = 9.78GRR39 pKa = 11.84KK40 pKa = 8.66VLSAA44 pKa = 4.05
Molecular weight: 5.11 kDa
Isoelectric point according different methods:
Peptides (in silico digests for buttom-up proteomics)
Below you can find in silico digests of the whole proteome with Trypsin, Chymotrypsin, Trypsin+LysC, LysN, ArgC proteases suitable for different mass spec machines.| Try ESI |
 |
|---|
| ChTry ESI |
 |
|---|
| ArgC ESI |
 |
|---|
| LysN ESI |
 |
|---|
| TryLysC ESI |
 |
|---|
| Try MALDI |
 |
|---|
| ChTry MALDI |
 |
|---|
| ArgC MALDI |
 |
|---|
| LysN MALDI |
 |
|---|
| TryLysC MALDI |
 |
|---|
| Try LTQ |
 |
|---|
| ChTry LTQ |
 |
|---|
| ArgC LTQ |
 |
|---|
| LysN LTQ |
 |
|---|
| TryLysC LTQ |
 |
|---|
| Try MSlow |
 |
|---|
| ChTry MSlow |
 |
|---|
| ArgC MSlow |
 |
|---|
| LysN MSlow |
 |
|---|
| TryLysC MSlow |
 |
|---|
| Try MShigh |
 |
|---|
| ChTry MShigh |
 |
|---|
| ArgC MShigh |
 |
|---|
| LysN MShigh |
 |
|---|
| TryLysC MShigh |
 |
|---|
General Statistics
Number of major isoforms |
Number of additional isoforms |
Number of all proteins |
Number of amino acids |
Min. Seq. Length |
Max. Seq. Length |
Avg. Seq. Length |
Avg. Mol. Weight |
|---|---|---|---|---|---|---|---|
0 |
397493 |
37 |
1969 |
306.2 |
34.36 |
Amino acid frequency
Ala |
Cys |
Asp |
Glu |
Phe |
Gly |
His |
Ile |
Lys |
Leu |
|---|---|---|---|---|---|---|---|---|---|
6.029 ± 0.067 | 0.946 ± 0.021 |
6.17 ± 0.057 | 6.848 ± 0.065 |
4.982 ± 0.055 | 6.445 ± 0.064 |
1.627 ± 0.029 | 8.951 ± 0.072 |
7.736 ± 0.083 | 9.199 ± 0.071 |
Met |
Asn |
Gln |
Pro |
Arg |
Ser |
Thr |
Val |
Trp |
Tyr |
|---|---|---|---|---|---|---|---|---|---|
2.371 ± 0.032 | 6.247 ± 0.058 |
3.411 ± 0.037 | 2.77 ± 0.028 |
3.459 ± 0.042 | 7.642 ± 0.057 |
4.662 ± 0.043 | 5.939 ± 0.062 |
1.008 ± 0.024 | 3.434 ± 0.038 |
Most of the basic statistics you can see at this page can be downloaded from this CSV file
Proteome-pI is available under Creative Commons Attribution-NoDerivs license, for more details see here
| Reference: Kozlowski LP. Proteome-pI 2.0: Proteome Isoelectric Point Database Update. Nucleic Acids Res. 2021, doi: 10.1093/nar/gkab944 | Contact: Lukasz P. Kozlowski |
