Arachidicoccus sp. BS20
Taxonomy: cellular organisms; Bacteria; FCB group; Bacteroidetes/Chlorobi group; Bacteroidetes; Chitinophagia; Chitinophagales; Chitinophagaceae; Arachidicoccus; unclassified Arachidicoccus
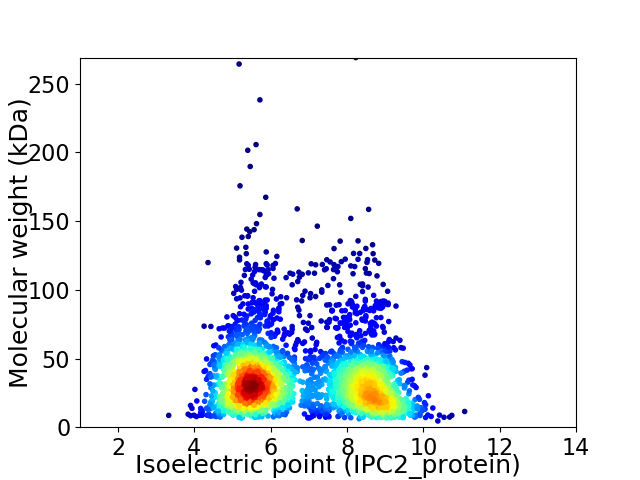
Average proteome isoelectric point is 6.84
Get precalculated fractions of proteins

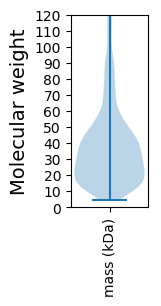
Virtual 2D-PAGE plot for 2946 proteins (isoelectric point calculated using IPC2_protein)
Get csv file with sequences according to given criteria:
* You can choose from 21 different methods for calculating isoelectric point
Summary statistics related to proteome-wise predictions


Protein with the lowest isoelectric point:
>tr|A0A191TMC5|A0A191TMC5_9BACT Phosphonate ABC transporter ATP-binding protein OS=Arachidicoccus sp. BS20 OX=1850526 GN=A9P82_11625 PE=4 SV=1
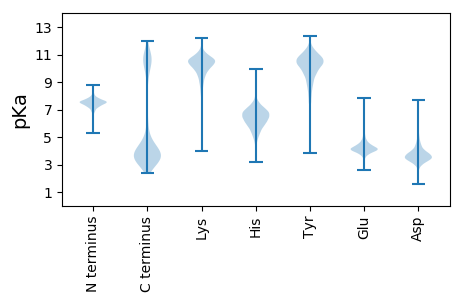
MM1 pKa = 7.7ANWCNNTVVFEE12 pKa = 4.48GKK14 pKa = 9.71PEE16 pKa = 5.0AIRR19 pKa = 11.84QIQQLFKK26 pKa = 11.18EE27 pKa = 4.47MAEE30 pKa = 4.02QEE32 pKa = 4.29QKK34 pKa = 10.61EE35 pKa = 4.76GCGQLPDD42 pKa = 5.15FVADD46 pKa = 3.64SNGGYY51 pKa = 10.47FFGIYY56 pKa = 9.34QDD58 pKa = 3.87YY59 pKa = 11.29DD60 pKa = 3.41NTDD63 pKa = 2.97TFQYY67 pKa = 6.7EE68 pKa = 4.89TKK70 pKa = 9.52WSPNMEE76 pKa = 4.29VLQKK80 pKa = 10.32IAEE83 pKa = 4.24HH84 pKa = 6.04YY85 pKa = 10.57KK86 pKa = 10.03VDD88 pKa = 4.19FTQDD92 pKa = 3.55YY93 pKa = 10.41EE94 pKa = 4.33EE95 pKa = 4.99LGCLVFGRR103 pKa = 11.84ATFSDD108 pKa = 3.79RR109 pKa = 11.84LLTDD113 pKa = 3.62IYY115 pKa = 11.06LDD117 pKa = 5.08DD118 pKa = 4.52EE119 pKa = 5.74DD120 pKa = 4.6FDD122 pKa = 4.2KK123 pKa = 11.78YY124 pKa = 11.15EE125 pKa = 4.08YY126 pKa = 10.8DD127 pKa = 3.61EE128 pKa = 5.2EE129 pKa = 4.82NSVWYY134 pKa = 10.16FEE136 pKa = 4.28GEE138 pKa = 4.41TYY140 pKa = 10.66EE141 pKa = 3.95SDD143 pKa = 4.03YY144 pKa = 11.37EE145 pKa = 3.93ILEE148 pKa = 4.06ILLEE152 pKa = 4.11RR153 pKa = 11.84KK154 pKa = 9.32IEE156 pKa = 4.02NHH158 pKa = 6.4HH159 pKa = 6.32PP160 pKa = 3.59
MM1 pKa = 7.7ANWCNNTVVFEE12 pKa = 4.48GKK14 pKa = 9.71PEE16 pKa = 5.0AIRR19 pKa = 11.84QIQQLFKK26 pKa = 11.18EE27 pKa = 4.47MAEE30 pKa = 4.02QEE32 pKa = 4.29QKK34 pKa = 10.61EE35 pKa = 4.76GCGQLPDD42 pKa = 5.15FVADD46 pKa = 3.64SNGGYY51 pKa = 10.47FFGIYY56 pKa = 9.34QDD58 pKa = 3.87YY59 pKa = 11.29DD60 pKa = 3.41NTDD63 pKa = 2.97TFQYY67 pKa = 6.7EE68 pKa = 4.89TKK70 pKa = 9.52WSPNMEE76 pKa = 4.29VLQKK80 pKa = 10.32IAEE83 pKa = 4.24HH84 pKa = 6.04YY85 pKa = 10.57KK86 pKa = 10.03VDD88 pKa = 4.19FTQDD92 pKa = 3.55YY93 pKa = 10.41EE94 pKa = 4.33EE95 pKa = 4.99LGCLVFGRR103 pKa = 11.84ATFSDD108 pKa = 3.79RR109 pKa = 11.84LLTDD113 pKa = 3.62IYY115 pKa = 11.06LDD117 pKa = 5.08DD118 pKa = 4.52EE119 pKa = 5.74DD120 pKa = 4.6FDD122 pKa = 4.2KK123 pKa = 11.78YY124 pKa = 11.15EE125 pKa = 4.08YY126 pKa = 10.8DD127 pKa = 3.61EE128 pKa = 5.2EE129 pKa = 4.82NSVWYY134 pKa = 10.16FEE136 pKa = 4.28GEE138 pKa = 4.41TYY140 pKa = 10.66EE141 pKa = 3.95SDD143 pKa = 4.03YY144 pKa = 11.37EE145 pKa = 3.93ILEE148 pKa = 4.06ILLEE152 pKa = 4.11RR153 pKa = 11.84KK154 pKa = 9.32IEE156 pKa = 4.02NHH158 pKa = 6.4HH159 pKa = 6.32PP160 pKa = 3.59
Molecular weight: 19.1 kDa
Isoelectric point according different methods:
Protein with the highest isoelectric point:
>tr|A0A191THK6|A0A191THK6_9BACT ABC transporter OS=Arachidicoccus sp. BS20 OX=1850526 GN=A9P82_02035 PE=4 SV=1
MM1 pKa = 7.44KK2 pKa = 10.31KK3 pKa = 10.46VILSLIVLIAATGLHH18 pKa = 5.98AQTVVVIHH26 pKa = 6.65RR27 pKa = 11.84PVIVAPRR34 pKa = 11.84VAVKK38 pKa = 9.74MGPVVATTPLPAPVVVAPRR57 pKa = 11.84PAVVVKK63 pKa = 9.08PAVVVAPKK71 pKa = 9.85PVVVRR76 pKa = 11.84PIVHH80 pKa = 6.09PVVVARR86 pKa = 11.84PVIVHH91 pKa = 6.58PAPVIVRR98 pKa = 11.84RR99 pKa = 11.84RR100 pKa = 11.84TVVVRR105 pKa = 11.84RR106 pKa = 11.84VYY108 pKa = 10.96
MM1 pKa = 7.44KK2 pKa = 10.31KK3 pKa = 10.46VILSLIVLIAATGLHH18 pKa = 5.98AQTVVVIHH26 pKa = 6.65RR27 pKa = 11.84PVIVAPRR34 pKa = 11.84VAVKK38 pKa = 9.74MGPVVATTPLPAPVVVAPRR57 pKa = 11.84PAVVVKK63 pKa = 9.08PAVVVAPKK71 pKa = 9.85PVVVRR76 pKa = 11.84PIVHH80 pKa = 6.09PVVVARR86 pKa = 11.84PVIVHH91 pKa = 6.58PAPVIVRR98 pKa = 11.84RR99 pKa = 11.84RR100 pKa = 11.84TVVVRR105 pKa = 11.84RR106 pKa = 11.84VYY108 pKa = 10.96
Molecular weight: 11.45 kDa
Isoelectric point according different methods:
Peptides (in silico digests for buttom-up proteomics)
Below you can find in silico digests of the whole proteome with Trypsin, Chymotrypsin, Trypsin+LysC, LysN, ArgC proteases suitable for different mass spec machines.| Try ESI |
 |
|---|
| ChTry ESI |
 |
|---|
| ArgC ESI |
 |
|---|
| LysN ESI |
 |
|---|
| TryLysC ESI |
 |
|---|
| Try MALDI |
 |
|---|
| ChTry MALDI |
 |
|---|
| ArgC MALDI |
 |
|---|
| LysN MALDI |
 |
|---|
| TryLysC MALDI |
 |
|---|
| Try LTQ |
 |
|---|
| ChTry LTQ |
 |
|---|
| ArgC LTQ |
 |
|---|
| LysN LTQ |
 |
|---|
| TryLysC LTQ |
 |
|---|
| Try MSlow |
 |
|---|
| ChTry MSlow |
 |
|---|
| ArgC MSlow |
 |
|---|
| LysN MSlow |
 |
|---|
| TryLysC MSlow |
 |
|---|
| Try MShigh |
 |
|---|
| ChTry MShigh |
 |
|---|
| ArgC MShigh |
 |
|---|
| LysN MShigh |
 |
|---|
| TryLysC MShigh |
 |
|---|
General Statistics
Number of major isoforms |
Number of additional isoforms |
Number of all proteins |
Number of amino acids |
Min. Seq. Length |
Max. Seq. Length |
Avg. Seq. Length |
Avg. Mol. Weight |
|---|---|---|---|---|---|---|---|
0 |
1021605 |
38 |
2443 |
346.8 |
39.07 |
Amino acid frequency
Ala |
Cys |
Asp |
Glu |
Phe |
Gly |
His |
Ile |
Lys |
Leu |
|---|---|---|---|---|---|---|---|---|---|
7.123 ± 0.033 | 0.798 ± 0.013 |
5.391 ± 0.029 | 5.598 ± 0.044 |
5.111 ± 0.031 | 6.393 ± 0.044 |
1.92 ± 0.02 | 7.541 ± 0.041 |
7.408 ± 0.045 | 9.178 ± 0.048 |
Met |
Asn |
Gln |
Pro |
Arg |
Ser |
Thr |
Val |
Trp |
Tyr |
|---|---|---|---|---|---|---|---|---|---|
2.181 ± 0.019 | 6.309 ± 0.053 |
3.6 ± 0.023 | 3.846 ± 0.026 |
3.569 ± 0.026 | 6.605 ± 0.037 |
5.686 ± 0.038 | 6.11 ± 0.027 |
1.234 ± 0.017 | 4.397 ± 0.035 |
Most of the basic statistics you can see at this page can be downloaded from this CSV file
Proteome-pI is available under Creative Commons Attribution-NoDerivs license, for more details see here
| Reference: Kozlowski LP. Proteome-pI 2.0: Proteome Isoelectric Point Database Update. Nucleic Acids Res. 2021, doi: 10.1093/nar/gkab944 | Contact: Lukasz P. Kozlowski |
