Podila verticillata NRRL 6337
Taxonomy: cellular organisms; Eukaryota; Opisthokonta; Fungi; Fungi incertae sedis; Mucoromycota; Mortierellomycotina; Mortierellomycetes; Mortierellales; Mortierellaceae; Podila; Podila verticillata
Average proteome isoelectric point is 6.48
Get precalculated fractions of proteins

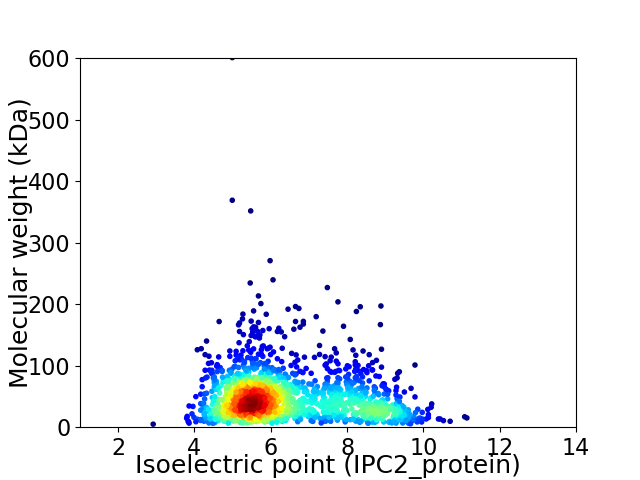
Virtual 2D-PAGE plot for 1514 proteins (isoelectric point calculated using IPC2_protein)
Get csv file with sequences according to given criteria:
* You can choose from 21 different methods for calculating isoelectric point
Summary statistics related to proteome-wise predictions


Protein with the lowest isoelectric point:
>tr|A0A086TM33|A0A086TM33_9FUNG Uncharacterized protein OS=Podila verticillata NRRL 6337 OX=1069443 GN=MVEG_11048 PE=4 SV=1
MM1 pKa = 6.78YY2 pKa = 10.18VAVVGVGSPATNYY15 pKa = 10.96DD16 pKa = 4.21LIVDD20 pKa = 4.43TGSSNTWVGASKK32 pKa = 10.76SYY34 pKa = 10.67TPTSTSQQTSDD45 pKa = 3.3SVSVTEE51 pKa = 4.36SGSTGFSGTEE61 pKa = 3.64YY62 pKa = 10.27TDD64 pKa = 3.33QVTLASGLVVSGQSIGVASTAKK86 pKa = 10.29GFKK89 pKa = 10.41DD90 pKa = 3.16VDD92 pKa = 4.48GILGLGPVDD101 pKa = 3.76LTVGTLSPDD110 pKa = 3.17TSSAIPTVVDD120 pKa = 3.35NLFSQGSIPGHH131 pKa = 5.4EE132 pKa = 4.06CSVYY136 pKa = 10.44FEE138 pKa = 5.97PITDD142 pKa = 3.39SSGIQQNGQITFGGTDD158 pKa = 3.03SSKK161 pKa = 9.12FTGEE165 pKa = 3.2ITYY168 pKa = 10.87APITTTSPASNYY180 pKa = 9.06WGVDD184 pKa = 2.82ASFSYY189 pKa = 11.16GSGSDD194 pKa = 3.11STTILSATAGIVDD207 pKa = 4.18SGTTLLPLATDD218 pKa = 4.54AFNSFQKK225 pKa = 10.15ATGGVKK231 pKa = 10.38DD232 pKa = 3.84SATGLLSITSQQFGNMKK249 pKa = 9.96SLYY252 pKa = 8.68VTISDD257 pKa = 3.83TVFEE261 pKa = 4.62LTPNALIWPRR271 pKa = 11.84SLNSIIGGTAGSIYY285 pKa = 10.53LIVTDD290 pKa = 4.17NGSNSGSGLDD300 pKa = 4.44FILGQKK306 pKa = 10.09FMEE309 pKa = 4.35RR310 pKa = 11.84FYY312 pKa = 11.08TVFDD316 pKa = 3.59TANQRR321 pKa = 11.84VGFATTPFTDD331 pKa = 3.16ATSNN335 pKa = 3.34
MM1 pKa = 6.78YY2 pKa = 10.18VAVVGVGSPATNYY15 pKa = 10.96DD16 pKa = 4.21LIVDD20 pKa = 4.43TGSSNTWVGASKK32 pKa = 10.76SYY34 pKa = 10.67TPTSTSQQTSDD45 pKa = 3.3SVSVTEE51 pKa = 4.36SGSTGFSGTEE61 pKa = 3.64YY62 pKa = 10.27TDD64 pKa = 3.33QVTLASGLVVSGQSIGVASTAKK86 pKa = 10.29GFKK89 pKa = 10.41DD90 pKa = 3.16VDD92 pKa = 4.48GILGLGPVDD101 pKa = 3.76LTVGTLSPDD110 pKa = 3.17TSSAIPTVVDD120 pKa = 3.35NLFSQGSIPGHH131 pKa = 5.4EE132 pKa = 4.06CSVYY136 pKa = 10.44FEE138 pKa = 5.97PITDD142 pKa = 3.39SSGIQQNGQITFGGTDD158 pKa = 3.03SSKK161 pKa = 9.12FTGEE165 pKa = 3.2ITYY168 pKa = 10.87APITTTSPASNYY180 pKa = 9.06WGVDD184 pKa = 2.82ASFSYY189 pKa = 11.16GSGSDD194 pKa = 3.11STTILSATAGIVDD207 pKa = 4.18SGTTLLPLATDD218 pKa = 4.54AFNSFQKK225 pKa = 10.15ATGGVKK231 pKa = 10.38DD232 pKa = 3.84SATGLLSITSQQFGNMKK249 pKa = 9.96SLYY252 pKa = 8.68VTISDD257 pKa = 3.83TVFEE261 pKa = 4.62LTPNALIWPRR271 pKa = 11.84SLNSIIGGTAGSIYY285 pKa = 10.53LIVTDD290 pKa = 4.17NGSNSGSGLDD300 pKa = 4.44FILGQKK306 pKa = 10.09FMEE309 pKa = 4.35RR310 pKa = 11.84FYY312 pKa = 11.08TVFDD316 pKa = 3.59TANQRR321 pKa = 11.84VGFATTPFTDD331 pKa = 3.16ATSNN335 pKa = 3.34
Molecular weight: 34.48 kDa
Isoelectric point according different methods:
Protein with the highest isoelectric point:
>tr|A0A086TKU8|A0A086TKU8_9FUNG 4-aminobutyrate aminotransferase OS=Podila verticillata NRRL 6337 OX=1069443 GN=MVEG_11968 PE=3 SV=1
MM1 pKa = 7.79PLFKK5 pKa = 10.46RR6 pKa = 11.84RR7 pKa = 11.84APVQHH12 pKa = 5.28VHH14 pKa = 6.05HH15 pKa = 7.12RR16 pKa = 11.84PSTMARR22 pKa = 11.84LKK24 pKa = 11.41AMFTPYY30 pKa = 9.95HH31 pKa = 6.16HH32 pKa = 7.87PYY34 pKa = 9.61NHH36 pKa = 6.66AHH38 pKa = 6.05GHH40 pKa = 4.81SQAPAPVSTQARR52 pKa = 11.84AAKK55 pKa = 9.72RR56 pKa = 11.84SLFGRR61 pKa = 11.84TPGAHH66 pKa = 6.7HH67 pKa = 7.27PTTATHH73 pKa = 5.21TRR75 pKa = 11.84RR76 pKa = 11.84RR77 pKa = 11.84NPFARR82 pKa = 11.84RR83 pKa = 11.84MGGTAQAAAVATAGHH98 pKa = 5.9HH99 pKa = 6.29HH100 pKa = 6.38GHH102 pKa = 6.87HH103 pKa = 6.23GHH105 pKa = 6.75HH106 pKa = 6.27GHH108 pKa = 7.13RR109 pKa = 11.84SPLASLKK116 pKa = 11.16AMFRR120 pKa = 11.84PRR122 pKa = 11.84RR123 pKa = 11.84SHH125 pKa = 4.91GHH127 pKa = 4.25SHH129 pKa = 6.8RR130 pKa = 11.84SHH132 pKa = 5.56YY133 pKa = 9.87TSS135 pKa = 3.45
MM1 pKa = 7.79PLFKK5 pKa = 10.46RR6 pKa = 11.84RR7 pKa = 11.84APVQHH12 pKa = 5.28VHH14 pKa = 6.05HH15 pKa = 7.12RR16 pKa = 11.84PSTMARR22 pKa = 11.84LKK24 pKa = 11.41AMFTPYY30 pKa = 9.95HH31 pKa = 6.16HH32 pKa = 7.87PYY34 pKa = 9.61NHH36 pKa = 6.66AHH38 pKa = 6.05GHH40 pKa = 4.81SQAPAPVSTQARR52 pKa = 11.84AAKK55 pKa = 9.72RR56 pKa = 11.84SLFGRR61 pKa = 11.84TPGAHH66 pKa = 6.7HH67 pKa = 7.27PTTATHH73 pKa = 5.21TRR75 pKa = 11.84RR76 pKa = 11.84RR77 pKa = 11.84NPFARR82 pKa = 11.84RR83 pKa = 11.84MGGTAQAAAVATAGHH98 pKa = 5.9HH99 pKa = 6.29HH100 pKa = 6.38GHH102 pKa = 6.87HH103 pKa = 6.23GHH105 pKa = 6.75HH106 pKa = 6.27GHH108 pKa = 7.13RR109 pKa = 11.84SPLASLKK116 pKa = 11.16AMFRR120 pKa = 11.84PRR122 pKa = 11.84RR123 pKa = 11.84SHH125 pKa = 4.91GHH127 pKa = 4.25SHH129 pKa = 6.8RR130 pKa = 11.84SHH132 pKa = 5.56YY133 pKa = 9.87TSS135 pKa = 3.45
Molecular weight: 15.07 kDa
Isoelectric point according different methods:
Peptides (in silico digests for buttom-up proteomics)
Below you can find in silico digests of the whole proteome with Trypsin, Chymotrypsin, Trypsin+LysC, LysN, ArgC proteases suitable for different mass spec machines.| Try ESI |
 |
|---|
| ChTry ESI |
 |
|---|
| ArgC ESI |
 |
|---|
| LysN ESI |
 |
|---|
| TryLysC ESI |
 |
|---|
| Try MALDI |
 |
|---|
| ChTry MALDI |
 |
|---|
| ArgC MALDI |
 |
|---|
| LysN MALDI |
 |
|---|
| TryLysC MALDI |
 |
|---|
| Try LTQ |
 |
|---|
| ChTry LTQ |
 |
|---|
| ArgC LTQ |
 |
|---|
| LysN LTQ |
 |
|---|
| TryLysC LTQ |
 |
|---|
| Try MSlow |
 |
|---|
| ChTry MSlow |
 |
|---|
| ArgC MSlow |
 |
|---|
| LysN MSlow |
 |
|---|
| TryLysC MSlow |
 |
|---|
| Try MShigh |
 |
|---|
| ChTry MShigh |
 |
|---|
| ArgC MShigh |
 |
|---|
| LysN MShigh |
 |
|---|
| TryLysC MShigh |
 |
|---|
General Statistics
Number of major isoforms |
Number of additional isoforms |
Number of all proteins |
Number of amino acids |
Min. Seq. Length |
Max. Seq. Length |
Avg. Seq. Length |
Avg. Mol. Weight |
|---|---|---|---|---|---|---|---|
708146 |
47 |
5427 |
467.7 |
51.87 |
Amino acid frequency
Ala |
Cys |
Asp |
Glu |
Phe |
Gly |
His |
Ile |
Lys |
Leu |
|---|---|---|---|---|---|---|---|---|---|
7.766 ± 0.068 | 1.238 ± 0.029 |
5.542 ± 0.048 | 5.903 ± 0.062 |
3.571 ± 0.037 | 6.142 ± 0.059 |
2.854 ± 0.04 | 5.075 ± 0.049 |
5.153 ± 0.068 | 9.392 ± 0.095 |
Met |
Asn |
Gln |
Pro |
Arg |
Ser |
Thr |
Val |
Trp |
Tyr |
|---|---|---|---|---|---|---|---|---|---|
2.386 ± 0.026 | 4.293 ± 0.055 |
5.508 ± 0.077 | 4.514 ± 0.066 |
5.225 ± 0.054 | 9.018 ± 0.095 |
6.471 ± 0.058 | 5.945 ± 0.053 |
1.201 ± 0.022 | 2.802 ± 0.033 |
Most of the basic statistics you can see at this page can be downloaded from this CSV file
Proteome-pI is available under Creative Commons Attribution-NoDerivs license, for more details see here
| Reference: Kozlowski LP. Proteome-pI 2.0: Proteome Isoelectric Point Database Update. Nucleic Acids Res. 2021, doi: 10.1093/nar/gkab944 | Contact: Lukasz P. Kozlowski |
