SAR86 cluster bacterium SAR86E
Taxonomy: cellular organisms; Bacteria; Proteobacteria; Gammaproteobacteria; Gammaproteobacteria incertae sedis; SAR86 cluster
Average proteome isoelectric point is 6.11
Get precalculated fractions of proteins

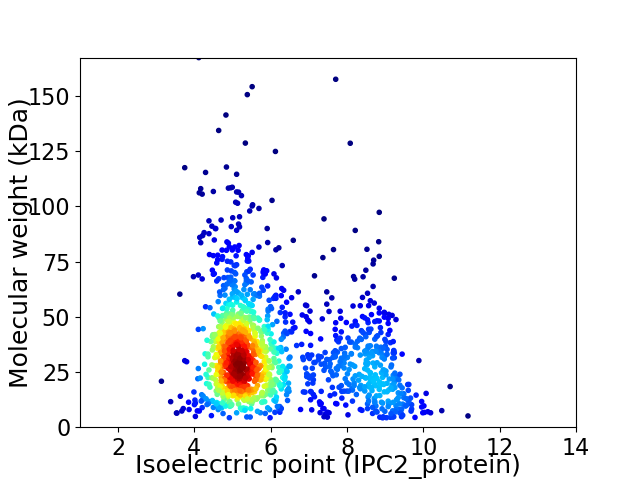
Virtual 2D-PAGE plot for 1403 proteins (isoelectric point calculated using IPC2_protein)
Get csv file with sequences according to given criteria:
* You can choose from 21 different methods for calculating isoelectric point
Summary statistics related to proteome-wise predictions


Protein with the lowest isoelectric point:
>tr|K6GJL4|K6GJL4_9GAMM ATP-dependent Clp protease ATP-binding subunit ClpX OS=SAR86 cluster bacterium SAR86E OX=1208365 GN=clpX PE=3 SV=1
MM1 pKa = 7.62KK2 pKa = 10.55NLLTLSLGLVFIASCGQTTTSTDD25 pKa = 2.95EE26 pKa = 3.88NVAYY30 pKa = 10.35DD31 pKa = 3.54LVGVQFYY38 pKa = 11.43NEE40 pKa = 5.39FIPCVPGSDD49 pKa = 3.45FTQEE53 pKa = 4.34NVDD56 pKa = 4.05SMMQGWRR63 pKa = 11.84SLNISDD69 pKa = 5.42DD70 pKa = 4.1LLGAWGYY77 pKa = 10.94VPATEE82 pKa = 4.26EE83 pKa = 4.31SRR85 pKa = 11.84FEE87 pKa = 4.17NGWWEE92 pKa = 4.13LQWASYY98 pKa = 10.59EE99 pKa = 4.07DD100 pKa = 5.2AKK102 pKa = 11.14AAWDD106 pKa = 3.41EE107 pKa = 4.09WTQDD111 pKa = 3.0EE112 pKa = 4.38EE113 pKa = 5.86AIAFLADD120 pKa = 3.52HH121 pKa = 6.85EE122 pKa = 4.98SVMVCDD128 pKa = 4.22GDD130 pKa = 5.47ARR132 pKa = 11.84GSWDD136 pKa = 3.32FTFHH140 pKa = 7.5RR141 pKa = 11.84DD142 pKa = 3.38VEE144 pKa = 4.93SFGPMPEE151 pKa = 4.67DD152 pKa = 3.27GSFFTEE158 pKa = 5.4FFPCKK163 pKa = 10.39YY164 pKa = 10.28NDD166 pKa = 3.7GKK168 pKa = 11.23SSEE171 pKa = 4.67DD172 pKa = 3.45LLGSIALYY180 pKa = 10.69NEE182 pKa = 3.94WLDD185 pKa = 3.53GLEE188 pKa = 3.8ITGAYY193 pKa = 10.08AYY195 pKa = 10.12GIYY198 pKa = 10.52AGDD201 pKa = 4.01GTDD204 pKa = 3.51EE205 pKa = 5.54LADD208 pKa = 3.99FWWGNFHH215 pKa = 7.3EE216 pKa = 4.82SAEE219 pKa = 4.26SAAVGNEE226 pKa = 3.04NWMEE230 pKa = 4.17SGGKK234 pKa = 9.58ARR236 pKa = 11.84ASLEE240 pKa = 3.73ATAACDD246 pKa = 3.89VPEE249 pKa = 5.03LYY251 pKa = 10.68NSGVIYY257 pKa = 10.62DD258 pKa = 3.98PARR261 pKa = 11.84PAFAKK266 pKa = 10.52SS267 pKa = 3.03
MM1 pKa = 7.62KK2 pKa = 10.55NLLTLSLGLVFIASCGQTTTSTDD25 pKa = 2.95EE26 pKa = 3.88NVAYY30 pKa = 10.35DD31 pKa = 3.54LVGVQFYY38 pKa = 11.43NEE40 pKa = 5.39FIPCVPGSDD49 pKa = 3.45FTQEE53 pKa = 4.34NVDD56 pKa = 4.05SMMQGWRR63 pKa = 11.84SLNISDD69 pKa = 5.42DD70 pKa = 4.1LLGAWGYY77 pKa = 10.94VPATEE82 pKa = 4.26EE83 pKa = 4.31SRR85 pKa = 11.84FEE87 pKa = 4.17NGWWEE92 pKa = 4.13LQWASYY98 pKa = 10.59EE99 pKa = 4.07DD100 pKa = 5.2AKK102 pKa = 11.14AAWDD106 pKa = 3.41EE107 pKa = 4.09WTQDD111 pKa = 3.0EE112 pKa = 4.38EE113 pKa = 5.86AIAFLADD120 pKa = 3.52HH121 pKa = 6.85EE122 pKa = 4.98SVMVCDD128 pKa = 4.22GDD130 pKa = 5.47ARR132 pKa = 11.84GSWDD136 pKa = 3.32FTFHH140 pKa = 7.5RR141 pKa = 11.84DD142 pKa = 3.38VEE144 pKa = 4.93SFGPMPEE151 pKa = 4.67DD152 pKa = 3.27GSFFTEE158 pKa = 5.4FFPCKK163 pKa = 10.39YY164 pKa = 10.28NDD166 pKa = 3.7GKK168 pKa = 11.23SSEE171 pKa = 4.67DD172 pKa = 3.45LLGSIALYY180 pKa = 10.69NEE182 pKa = 3.94WLDD185 pKa = 3.53GLEE188 pKa = 3.8ITGAYY193 pKa = 10.08AYY195 pKa = 10.12GIYY198 pKa = 10.52AGDD201 pKa = 4.01GTDD204 pKa = 3.51EE205 pKa = 5.54LADD208 pKa = 3.99FWWGNFHH215 pKa = 7.3EE216 pKa = 4.82SAEE219 pKa = 4.26SAAVGNEE226 pKa = 3.04NWMEE230 pKa = 4.17SGGKK234 pKa = 9.58ARR236 pKa = 11.84ASLEE240 pKa = 3.73ATAACDD246 pKa = 3.89VPEE249 pKa = 5.03LYY251 pKa = 10.68NSGVIYY257 pKa = 10.62DD258 pKa = 3.98PARR261 pKa = 11.84PAFAKK266 pKa = 10.52SS267 pKa = 3.03
Molecular weight: 29.64 kDa
Isoelectric point according different methods:
Protein with the highest isoelectric point:
>tr|K6GIN0|K6GIN0_9GAMM RNA polymerase sigma factor RpoH OS=SAR86 cluster bacterium SAR86E OX=1208365 GN=rpoH PE=3 SV=1
MM1 pKa = 7.45KK2 pKa = 9.56RR3 pKa = 11.84TFQPSTLKK11 pKa = 10.5RR12 pKa = 11.84KK13 pKa = 7.79RR14 pKa = 11.84THH16 pKa = 5.92GFRR19 pKa = 11.84ARR21 pKa = 11.84MSTKK25 pKa = 10.19AGRR28 pKa = 11.84AVIANRR34 pKa = 11.84RR35 pKa = 11.84KK36 pKa = 10.05KK37 pKa = 9.73GRR39 pKa = 11.84KK40 pKa = 8.97VLTAA44 pKa = 4.27
MM1 pKa = 7.45KK2 pKa = 9.56RR3 pKa = 11.84TFQPSTLKK11 pKa = 10.5RR12 pKa = 11.84KK13 pKa = 7.79RR14 pKa = 11.84THH16 pKa = 5.92GFRR19 pKa = 11.84ARR21 pKa = 11.84MSTKK25 pKa = 10.19AGRR28 pKa = 11.84AVIANRR34 pKa = 11.84RR35 pKa = 11.84KK36 pKa = 10.05KK37 pKa = 9.73GRR39 pKa = 11.84KK40 pKa = 8.97VLTAA44 pKa = 4.27
Molecular weight: 5.1 kDa
Isoelectric point according different methods:
Peptides (in silico digests for buttom-up proteomics)
Below you can find in silico digests of the whole proteome with Trypsin, Chymotrypsin, Trypsin+LysC, LysN, ArgC proteases suitable for different mass spec machines.| Try ESI |
 |
|---|
| ChTry ESI |
 |
|---|
| ArgC ESI |
 |
|---|
| LysN ESI |
 |
|---|
| TryLysC ESI |
 |
|---|
| Try MALDI |
 |
|---|
| ChTry MALDI |
 |
|---|
| ArgC MALDI |
 |
|---|
| LysN MALDI |
 |
|---|
| TryLysC MALDI |
 |
|---|
| Try LTQ |
 |
|---|
| ChTry LTQ |
 |
|---|
| ArgC LTQ |
 |
|---|
| LysN LTQ |
 |
|---|
| TryLysC LTQ |
 |
|---|
| Try MSlow |
 |
|---|
| ChTry MSlow |
 |
|---|
| ArgC MSlow |
 |
|---|
| LysN MSlow |
 |
|---|
| TryLysC MSlow |
 |
|---|
| Try MShigh |
 |
|---|
| ChTry MShigh |
 |
|---|
| ArgC MShigh |
 |
|---|
| LysN MShigh |
 |
|---|
| TryLysC MShigh |
 |
|---|
General Statistics
Number of major isoforms |
Number of additional isoforms |
Number of all proteins |
Number of amino acids |
Min. Seq. Length |
Max. Seq. Length |
Avg. Seq. Length |
Avg. Mol. Weight |
|---|---|---|---|---|---|---|---|
0 |
442143 |
37 |
1507 |
315.1 |
35.13 |
Amino acid frequency
Ala |
Cys |
Asp |
Glu |
Phe |
Gly |
His |
Ile |
Lys |
Leu |
|---|---|---|---|---|---|---|---|---|---|
7.038 ± 0.052 | 0.951 ± 0.02 |
5.785 ± 0.053 | 6.523 ± 0.058 |
4.918 ± 0.05 | 6.846 ± 0.062 |
1.917 ± 0.034 | 8.244 ± 0.068 |
6.812 ± 0.073 | 9.795 ± 0.067 |
Met |
Asn |
Gln |
Pro |
Arg |
Ser |
Thr |
Val |
Trp |
Tyr |
|---|---|---|---|---|---|---|---|---|---|
2.449 ± 0.03 | 5.451 ± 0.047 |
3.784 ± 0.034 | 3.418 ± 0.035 |
3.595 ± 0.047 | 7.784 ± 0.057 |
4.786 ± 0.043 | 5.763 ± 0.052 |
1.073 ± 0.024 | 3.068 ± 0.03 |
Most of the basic statistics you can see at this page can be downloaded from this CSV file
Proteome-pI is available under Creative Commons Attribution-NoDerivs license, for more details see here
| Reference: Kozlowski LP. Proteome-pI 2.0: Proteome Isoelectric Point Database Update. Nucleic Acids Res. 2021, doi: 10.1093/nar/gkab944 | Contact: Lukasz P. Kozlowski |
